## Line Chart: Cosine Similarity vs. Layers
### Overview
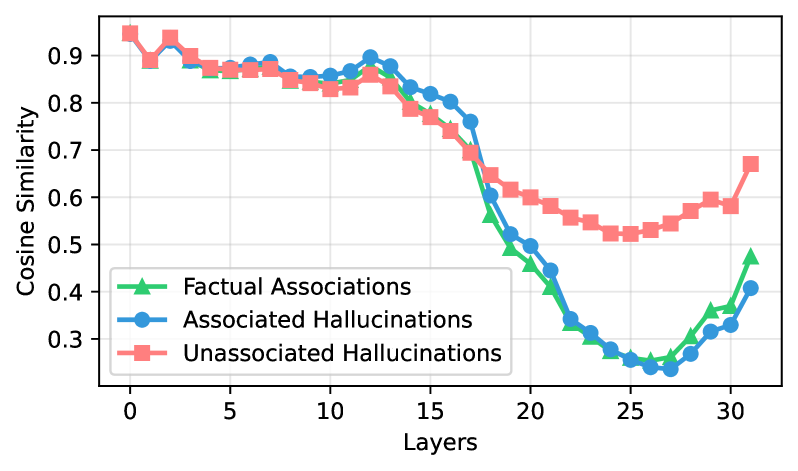
The image presents a line chart illustrating the relationship between the number of layers in a model and the cosine similarity of different types of associations and hallucinations. Three data series are plotted: Factual Associations, Associated Hallucinations, and Unassociated Hallucinations. The chart appears to be investigating how model depth (number of layers) affects the quality of information retained and the occurrence of hallucinations.
### Components/Axes
* **X-axis:** "Layers" - ranging from approximately 0 to 32.
* **Y-axis:** "Cosine Similarity" - ranging from approximately 0.2 to 1.0.
* **Legend:** Located in the bottom-right corner.
* "Factual Associations" - represented by a green line with triangle markers.
* "Associated Hallucinations" - represented by a blue line with circle markers.
* "Unassociated Hallucinations" - represented by a red line with square markers, with a shaded area indicating standard deviation.
* **Grid:** A light gray grid is present in the background to aid in reading values.
### Detailed Analysis
* **Unassociated Hallucinations (Red):** This line starts at approximately 0.93 at Layer 0 and generally decreases, with some fluctuations, to around 0.58 at Layer 32. The shaded area indicates a relatively consistent standard deviation around the mean.
* **Associated Hallucinations (Blue):** This line begins at approximately 0.88 at Layer 0 and also decreases, more rapidly than the Unassociated Hallucinations, reaching around 0.32 at Layer 32.
* **Factual Associations (Green):** This line starts at approximately 0.35 at Layer 0 and remains relatively flat until around Layer 18, where it begins to increase, reaching approximately 0.42 at Layer 32.
**Specific Data Points (approximate):**
| Layers | Factual Associations | Associated Hallucinations | Unassociated Hallucinations |
|---|---|---|---|
| 0 | 0.35 | 0.88 | 0.93 |
| 5 | 0.36 | 0.84 | 0.89 |
| 10 | 0.37 | 0.81 | 0.86 |
| 15 | 0.38 | 0.74 | 0.78 |
| 20 | 0.39 | 0.58 | 0.65 |
| 25 | 0.40 | 0.42 | 0.58 |
| 30 | 0.41 | 0.35 | 0.60 |
| 32 | 0.42 | 0.32 | 0.58 |
### Key Observations
* All three lines exhibit a decreasing trend in cosine similarity as the number of layers increases, but at different rates.
* Unassociated Hallucinations maintain a higher cosine similarity than Associated Hallucinations throughout the range of layers.
* Factual Associations have the lowest cosine similarity overall, but show an increasing trend in the later layers.
* The standard deviation around the Unassociated Hallucinations line is relatively small, suggesting consistency in this type of hallucination.
### Interpretation
The data suggests that as the model depth increases (more layers are added), the similarity to factual information decreases for both types of hallucinations, but the decrease is more pronounced for associated hallucinations. This could indicate that deeper models are more prone to generating hallucinations that are less grounded in reality. The increasing trend in Factual Associations in the later layers is interesting and could suggest that deeper models are capable of learning more complex factual relationships, but this increase is relatively small compared to the decrease in hallucination similarity. The higher similarity scores for Unassociated Hallucinations suggest that these types of hallucinations are more persistent and less affected by model depth.
The chart highlights a trade-off between model depth and the quality of information retained. While deeper models may be capable of learning more complex patterns, they also appear to be more susceptible to generating hallucinations. This suggests that careful consideration must be given to model depth when designing and training large language models, and that techniques for mitigating hallucinations may be particularly important for deeper models. The difference between "Associated" and "Unassociated" hallucinations is also important. "Associated" hallucinations are likely more dangerous, as they are tied to some input or context, and therefore more likely to be believed.