## Line Graph: Cosine Similarity Across Layers
### Overview
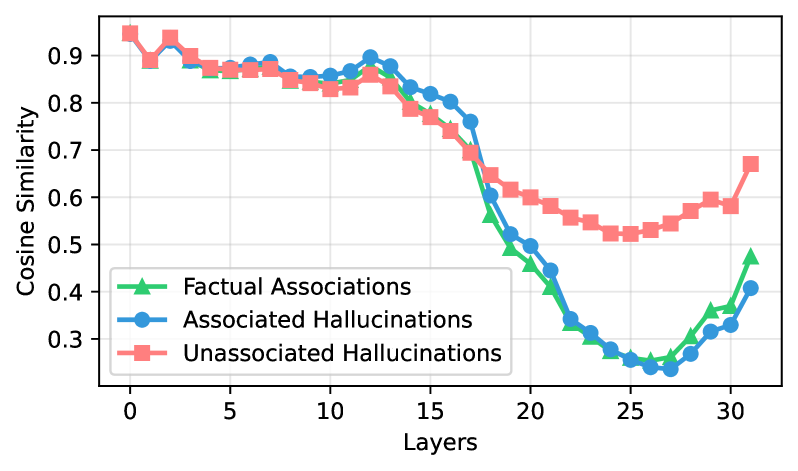
The image is a line graph depicting the cosine similarity of three categories—Factual Associations, Associated Hallucinations, and Unassociated Hallucinations—across 30 layers. The y-axis represents cosine similarity (0.3–0.9), and the x-axis represents layers (0–30). Three distinct lines (green, blue, red) correspond to the categories, with trends showing initial high similarity, a decline, and partial recovery in later layers.
### Components/Axes
- **X-axis (Layers)**: Labeled "Layers," ranging from 0 to 30 in increments of 5.
- **Y-axis (Cosine Similarity)**: Labeled "Cosine Similarity," ranging from 0.3 to 0.9 in increments of 0.1.
- **Legend**: Located in the bottom-left corner, with three entries:
- Green line (triangle markers): Factual Associations
- Blue line (circle markers): Associated Hallucinations
- Red line (square markers): Unassociated Hallucinations
### Detailed Analysis
1. **Factual Associations (Green Line)**:
- Starts at ~0.9 at layer 0.
- Declines gradually to ~0.85 by layer 10.
- Drops sharply to ~0.4 at layer 20.
- Recovers to ~0.5 by layer 30.
2. **Associated Hallucinations (Blue Line)**:
- Starts at ~0.9 at layer 0.
- Declines to ~0.85 by layer 10.
- Drops sharply to ~0.3 at layer 25.
- Recovers to ~0.4 by layer 30.
3. **Unassociated Hallucinations (Red Line)**:
- Starts at ~0.9 at layer 0.
- Declines slightly to ~0.85 by layer 10.
- Remains relatively flat (~0.55–0.65) from layer 15 to 30.
- Ends at ~0.65 at layer 30.
### Key Observations
- All three categories exhibit a decline in cosine similarity between layers 10–20, with the steepest drops occurring around layer 15–20.
- Factual Associations and Associated Hallucinations show a more pronounced recovery in later layers (20–30) compared to Unassociated Hallucinations.
- Unassociated Hallucinations maintain higher similarity in later layers (~0.55–0.65) than the other two categories.
- The green and blue lines converge closely until layer 15, then diverge significantly.
### Interpretation
The data suggests that cosine similarity decreases as layers increase, indicating potential divergence or loss of alignment in the modeled relationships. The recovery in later layers (20–30) for Factual Associations and Associated Hallucinations may reflect stabilization or compensatory mechanisms. Unassociated Hallucinations, however, retain higher similarity in later layers, possibly due to structural differences or reduced sensitivity to layer-specific changes. The divergence between the green and blue lines after layer 15 highlights distinct behaviors between factual and associated hallucinations, while the red line’s stability suggests a more consistent performance across layers.