## Bar Chart: Recompute Cost vs. Window Size
### Overview
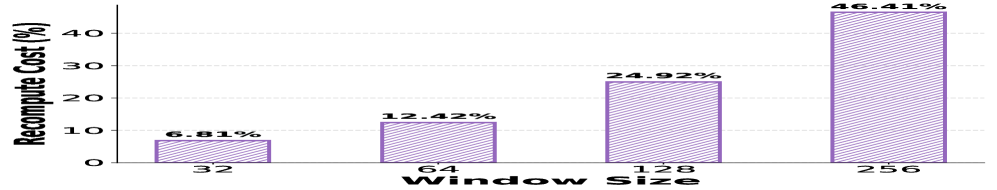
The image is a bar chart that illustrates the relationship between "Window Size" and "Recompute Cost (%)". The chart displays four data points, each representing a different window size (32, 64, 128, and 256) and their corresponding recompute cost percentages. The bars are purple with a diagonal line pattern.
### Components/Axes
* **Y-axis (Vertical):** "Recompute Cost (%)". The scale ranges from 0 to 40, with implied tick marks at intervals of 10.
* **X-axis (Horizontal):** "Window Size". The categories are discrete values: 32, 64, 128, and 256.
* **Bars:** Purple bars represent the recompute cost for each window size. The exact percentage value is displayed above each bar.
* **Gridlines:** Horizontal gridlines are present to aid in reading the values on the y-axis.
### Detailed Analysis
The chart shows a clear upward trend: as the window size increases, the recompute cost also increases.
* **Window Size 32:** Recompute Cost is 6.81%.
* **Window Size 64:** Recompute Cost is 12.42%.
* **Window Size 128:** Recompute Cost is 24.92%.
* **Window Size 256:** Recompute Cost is 46.41%.
### Key Observations
* The recompute cost more than doubles when the window size increases from 128 to 256.
* The recompute cost increases consistently with the window size.
### Interpretation
The bar chart demonstrates a positive correlation between window size and recompute cost. This suggests that larger window sizes require more recomputation, potentially due to increased complexity or data volume. The significant jump in recompute cost between window sizes 128 and 256 indicates a possible threshold where the computational demands increase substantially. This information is valuable for optimizing window size selection in systems where recomputation is a factor.