\n
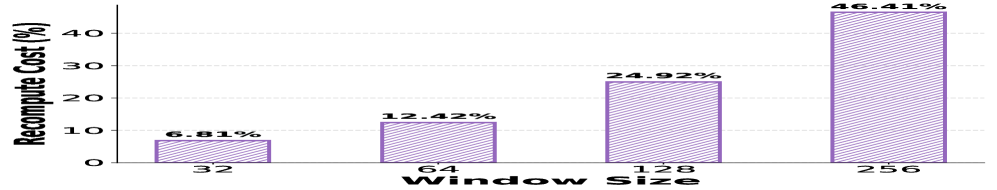
## Bar Chart: Recompute Cost vs. Window Size
### Overview
This image presents a bar chart illustrating the relationship between "Window Size" and "Recompute Cost (%)." The chart displays the recompute cost for four different window sizes: 32, 64, 128, and 256. The recompute cost increases significantly as the window size increases.
### Components/Axes
* **X-axis:** "Window Size" with markers at 32, 64, 128, and 256.
* **Y-axis:** "Recompute Cost (%)" ranging from 0 to approximately 50%.
* **Bars:** Four vertical bars representing the recompute cost for each window size. The bars are filled with a diagonal hatch pattern and are colored in a light purple hue.
* **Data Labels:** Each bar is labeled with the corresponding recompute cost percentage.
### Detailed Analysis
The chart shows a clear upward trend: as the window size increases, the recompute cost also increases. Let's examine the specific values:
* **Window Size 32:** Recompute Cost is 6.81%.
* **Window Size 64:** Recompute Cost is 12.42%. This represents an increase of approximately 5.61% compared to a window size of 32.
* **Window Size 128:** Recompute Cost is 24.92%. This represents an increase of approximately 12.5% compared to a window size of 64.
* **Window Size 256:** Recompute Cost is 46.41%. This represents an increase of approximately 21.49% compared to a window size of 128.
The increase in recompute cost is not linear; it appears to accelerate as the window size grows larger.
### Key Observations
* The recompute cost is relatively low for small window sizes (32 and 64).
* The recompute cost increases dramatically for larger window sizes (128 and 256).
* The largest window size (256) results in a recompute cost that is more than six times higher than the smallest window size (32).
### Interpretation
This data suggests that increasing the window size significantly increases the computational cost of recomputation. This is likely due to the increased amount of data that needs to be processed when the window size is larger. The accelerating increase in recompute cost for larger window sizes indicates that the computational complexity may be more than linear with respect to window size.
This information is valuable for system designers who need to balance the benefits of larger window sizes (e.g., improved accuracy or responsiveness) against the increased computational cost. The chart highlights the trade-off between window size and recompute cost, and it can help designers choose an appropriate window size for their specific application. The data suggests that for applications where recompute cost is a critical factor, it may be preferable to use smaller window sizes, even if it means sacrificing some accuracy or responsiveness.