## Bar Chart: Recompute Cost by Window Size
### Overview
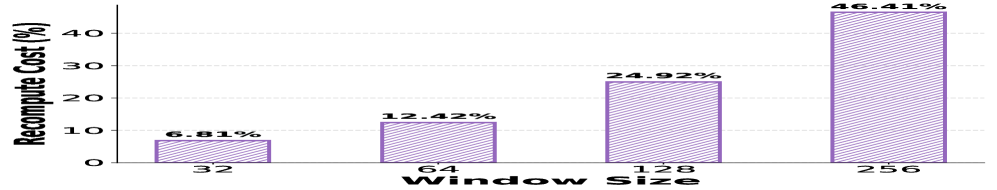
The chart illustrates the relationship between window size and recompute cost as a percentage. It uses four vertical bars to represent different window sizes (32, 64, 128, 256) and their corresponding recompute costs. The y-axis scales from 0% to 40% in 10% increments, with the highest bar exceeding this range at 46.41%.
### Components/Axes
- **X-axis (Window Size)**: Labeled with discrete values: 32, 64, 128, 256.
- **Y-axis (Recompute Cost %)**: Scaled from 0% to 40% in 10% increments, with an extended range to accommodate the 46.41% value.
- **Legend**: A single entry for "Recompute Cost (%)" represented by purple bars with diagonal hatching.
- **Bars**: Four purple bars with diagonal hatching, positioned at the specified window sizes.
### Detailed Analysis
- **Window Size 32**: Recompute cost = 6.81% (shortest bar).
- **Window Size 64**: Recompute cost = 12.42% (moderate increase).
- **Window Size 128**: Recompute cost = 24.92% (significant jump).
- **Window Size 256**: Recompute cost = 46.41% (highest value, exceeding the y-axis maximum).
### Key Observations
1. **Exponential Growth**: Recompute cost increases non-linearly with window size. The jump from 128 to 256 results in a 100% increase in cost (24.92% → 46.41%).
2. **Threshold Effect**: The largest window size (256) accounts for over 46% of recompute costs, suggesting diminishing returns or inefficiencies at scale.
3. **Visual Consistency**: All bars use the same purple color and diagonal hatching, confirming a single data series.
### Interpretation
The data demonstrates that recompute costs scale disproportionately with window size, particularly beyond 128. This implies that larger window sizes may introduce significant computational overhead, potentially impacting system performance or resource allocation. The sharp increase at 256 suggests a critical threshold where optimization strategies (e.g., parallel processing, caching) might be necessary to mitigate costs. The absence of other data series or variables indicates this analysis focuses solely on the direct relationship between window size and recompute efficiency.