\n
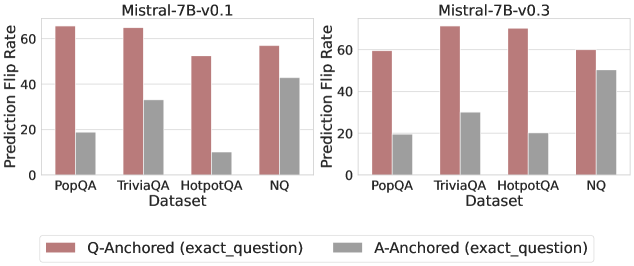
## Bar Chart: Prediction Flip Rate for Mistral Models
### Overview
This image presents a comparative bar chart showing the prediction flip rate for two versions of the Mistral-7B model (v0.1 and v0.3) across four different datasets: PopQA, TriviaQA, HotpotQA, and NQ. The flip rate is measured on the Y-axis, while the datasets are displayed on the X-axis. Each dataset has two bars representing "Q-Anchored" and "A-Anchored" predictions.
### Components/Axes
* **X-axis:** "Dataset" with categories: PopQA, TriviaQA, HotpotQA, NQ.
* **Y-axis:** "Prediction Flip Rate" with a scale from 0 to 60 (approximately).
* **Models:** Two separate charts, one for "Mistral-7B-v0.1" and one for "Mistral-7B-v0.3", positioned side-by-side.
* **Legend:** Located at the bottom-center of the image.
* Red bar: "Q-Anchored (exact\_question)"
* Gray bar: "A-Anchored (exact\_question)"
### Detailed Analysis or Content Details
**Mistral-7B-v0.1 Chart:**
* **PopQA:**
* Q-Anchored: Approximately 55.
* A-Anchored: Approximately 15.
* **TriviaQA:**
* Q-Anchored: Approximately 55.
* A-Anchored: Approximately 30.
* **HotpotQA:**
* Q-Anchored: Approximately 45.
* A-Anchored: Approximately 10.
* **NQ:**
* Q-Anchored: Approximately 50.
* A-Anchored: Approximately 45.
**Mistral-7B-v0.3 Chart:**
* **PopQA:**
* Q-Anchored: Approximately 50.
* A-Anchored: Approximately 10.
* **TriviaQA:**
* Q-Anchored: Approximately 60.
* A-Anchored: Approximately 25.
* **HotpotQA:**
* Q-Anchored: Approximately 50.
* A-Anchored: Approximately 15.
* **NQ:**
* Q-Anchored: Approximately 50.
* A-Anchored: Approximately 45.
**Trends:**
* In both models, the Q-Anchored bars are consistently higher than the A-Anchored bars across all datasets, indicating a higher prediction flip rate when the question is anchored.
* For both models, TriviaQA generally shows the highest Q-Anchored flip rate.
* HotpotQA consistently shows the lowest A-Anchored flip rate.
### Key Observations
* The prediction flip rate is significantly higher for Q-Anchored predictions compared to A-Anchored predictions in all datasets for both models.
* The Mistral-7B-v0.3 model shows a slight decrease in Q-Anchored flip rate for PopQA compared to v0.1.
* The Mistral-7B-v0.3 model shows an increase in Q-Anchored flip rate for TriviaQA compared to v0.1.
* The A-Anchored flip rates are generally lower and more consistent across datasets.
### Interpretation
The data suggests that anchoring predictions to the question (Q-Anchored) leads to a higher rate of prediction flips compared to anchoring to the answer (A-Anchored). This could indicate that the model is more sensitive to variations in the question phrasing or that the question provides more informative cues for prediction. The differences between the two model versions (v0.1 and v0.3) suggest that model updates can influence the prediction flip rate, potentially due to changes in the model's architecture or training data. The varying flip rates across datasets may reflect the inherent difficulty and characteristics of each dataset. For example, TriviaQA, with its higher flip rate, might contain more ambiguous or challenging questions. The relatively low A-Anchored flip rates suggest that the model is more stable when relying on the answer context. This data is valuable for understanding the model's behavior and identifying areas for improvement, particularly in terms of robustness to question variations and sensitivity to different types of knowledge.