## Grouped Bar Chart: Prediction Flip Rate Comparison for Mistral-7B Model Versions
### Overview
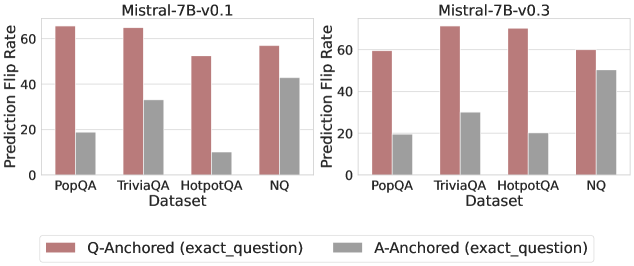
The image displays two side-by-side grouped bar charts comparing the "Prediction Flip Rate" of two versions of the Mistral-7B language model (v0.1 and v0.3) across four different question-answering datasets. The charts evaluate the stability of model predictions under two different anchoring conditions.
### Components/Axes
* **Chart Titles (Top Center):**
* Left Chart: `Mistral-7B-v0.1`
* Right Chart: `Mistral-7B-v0.3`
* **Y-Axis (Vertical, Left of each chart):**
* Label: `Prediction Flip Rate`
* Scale: Linear, from 0 to 60, with major tick marks at 0, 20, 40, and 60.
* **X-Axis (Horizontal, Bottom of each chart):**
* Label: `Dataset`
* Categories (from left to right): `PopQA`, `TriviaQA`, `HotpotQA`, `NQ`
* **Legend (Bottom Center, spanning both charts):**
* A colored box and label pair.
* **Red/Brown Bar:** `Q-Anchored (exact_question)`
* **Gray Bar:** `A-Anchored (exact_question)`
### Detailed Analysis
The data is presented as pairs of bars for each dataset, one for each anchoring method. Values are approximate visual estimates.
**For Mistral-7B-v0.1 (Left Chart):**
* **PopQA:**
* Q-Anchored: ~65
* A-Anchored: ~18
* **TriviaQA:**
* Q-Anchored: ~65
* A-Anchored: ~33
* **HotpotQA:**
* Q-Anchored: ~52
* A-Anchored: ~10
* **NQ:**
* Q-Anchored: ~58
* A-Anchored: ~43
**For Mistral-7B-v0.3 (Right Chart):**
* **PopQA:**
* Q-Anchored: ~59
* A-Anchored: ~19
* **TriviaQA:**
* Q-Anchored: ~70
* A-Anchored: ~30
* **HotpotQA:**
* Q-Anchored: ~69
* A-Anchored: ~20
* **NQ:**
* Q-Anchored: ~59
* A-Anchored: ~50
**Visual Trend Verification:**
* In **both model versions**, for **every dataset**, the red/brown bar (Q-Anchored) is significantly taller than the gray bar (A-Anchored). This indicates a consistently higher prediction flip rate when the model is anchored to the exact question versus the exact answer.
* Comparing **v0.1 to v0.3**, the Q-Anchored flip rates for `TriviaQA` and `HotpotQA` show a noticeable increase, while the rate for `PopQA` slightly decreases. The A-Anchored rates show mixed, smaller changes.
### Key Observations
1. **Dominant Pattern:** The Q-Anchored condition universally results in a higher prediction flip rate than the A-Anchored condition across all datasets and both model versions.
2. **Dataset Variability:** The magnitude of the difference between anchoring methods varies by dataset. The gap is largest for `HotpotQA` in v0.1 (~42 point difference) and smallest for `NQ` in v0.3 (~9 point difference).
3. **Model Version Change:** The transition from v0.1 to v0.3 appears to increase the model's sensitivity (higher flip rate) to question anchoring for more complex datasets like `TriviaQA` and `HotpotQA`, while making it slightly more stable (lower flip rate) for `PopQA` under the same condition.
4. **Highest Flip Rate:** The single highest observed flip rate is for `TriviaQA` under Q-Anchoring in the v0.3 model (~70).
5. **Lowest Flip Rate:** The single lowest observed flip rate is for `HotpotQA` under A-Anchoring in the v0.1 model (~10).
### Interpretation
This chart investigates the stability of a language model's outputs. A "prediction flip" likely means the model gives a different answer when prompted in a slightly different way. The data suggests that **anchoring the model's context to the exact question (Q-Anchored) makes its outputs far less stable** than anchoring to the exact answer (A-Anchored). This implies the model's reasoning or retrieval process is more volatile when focused on the query itself.
The difference between model versions (v0.1 vs. v0.3) indicates that updates to the model can alter this stability profile in dataset-specific ways. The increase in flip rate for `TriviaQA` and `HotpotQA` in v0.3 might suggest the newer model is more sensitive to question phrasing or engages in more varied reasoning paths for these types of questions. Conversely, the decreased flip rate for `PopQA` could indicate improved consistency on that specific knowledge domain.
From a practical standpoint, this has implications for evaluation and deployment. If a model's answers flip frequently based on minor prompt variations (especially question-anchored ones), its reliability in real-world applications, where queries are never perfectly standardized, could be a concern. The A-Anchored results provide a baseline, showing the model is more consistent when the answer is fixed in context.