## Bar Chart: Prediction Flip Rate Comparison for Mistral-7B Models (v0.1 vs v0.3)
### Overview
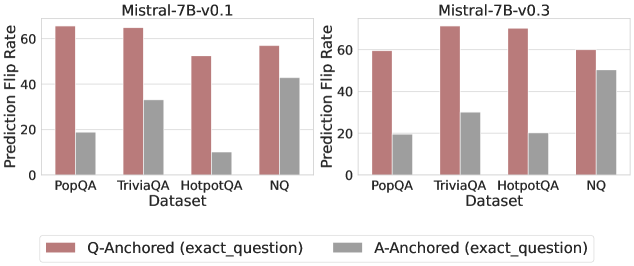
The chart compares prediction flip rates (in percentage) for two versions of the Mistral-7B language model (v0.1 and v0.3) across four question-answering datasets (PopQA, TriviaQA, HotpotQA, NQ). Two anchoring methods are evaluated: **Q-Anchored (exact_question)** (red bars) and **A-Anchored (exact_question)** (gray bars). The y-axis ranges from 0% to 60%, with error bars indicating uncertainty.
---
### Components/Axes
- **X-Axis (Datasets)**: PopQA, TriviaQA, HotpotQA, NQ (left to right).
- **Y-Axis (Prediction Flip Rate)**: Percentage scale (0–60%).
- **Legend**:
- Red = Q-Anchored (exact_question)
- Gray = A-Anchored (exact_question)
- **Model Versions**:
- Left group = Mistral-7B-v0.1
- Right group = Mistral-7B-v0.3
---
### Detailed Analysis
#### Mistral-7B-v0.1
- **PopQA**:
- Q-Anchored: ~65% (±2%)
- A-Anchored: ~20% (±3%)
- **TriviaQA**:
- Q-Anchored: ~63% (±1%)
- A-Anchored: ~30% (±2%)
- **HotpotQA**:
- Q-Anchored: ~55% (±3%)
- A-Anchored: ~10% (±1%)
- **NQ**:
- Q-Anchored: ~58% (±2%)
- A-Anchored: ~42% (±3%)
#### Mistral-7B-v0.3
- **PopQA**:
- Q-Anchored: ~58% (±2%)
- A-Anchored: ~20% (±2%)
- **TriviaQA**:
- Q-Anchored: ~63% (±1%)
- A-Anchored: ~28% (±2%)
- **HotpotQA**:
- Q-Anchored: ~62% (±1%)
- A-Anchored: ~20% (±1%)
- **NQ**:
- Q-Anchored: ~58% (±2%)
- A-Anchored: ~47% (±3%)
---
### Key Observations
1. **Q-Anchored Consistency**:
- Q-Anchored rates remain stable or slightly decrease in v0.3 across all datasets (e.g., PopQA drops from 65% to 58%).
- NQ shows no change in Q-Anchored performance between versions (~58% in both).
2. **A-Anchored Variability**:
- A-Anchored rates improve in v0.3 for NQ (+5% increase to 47%) but remain stagnant or decrease in other datasets (e.g., TriviaQA drops from 30% to 28%).
3. **Dataset-Specific Trends**:
- **NQ** exhibits the highest A-Anchored flip rates in both versions (~42% in v0.1, ~47% in v0.3), suggesting it is more sensitive to anchoring methods.
- **HotpotQA** shows the largest gap between anchoring methods (~55% Q vs. ~10% A in v0.1; ~62% Q vs. ~20% A in v0.3).
---
### Interpretation
The data demonstrates that **Q-Anchored (exact_question)** methods consistently outperform A-Anchored (exact_question) across both model versions, with Q-Anchored rates remaining stable or improving slightly in v0.3. The exception is **NQ**, where A-Anchored performance improves significantly in v0.3 (+5%), indicating potential architectural or training improvements in handling answer-specific context. However, Q-Anchored still dominates, suggesting that question-level anchoring is more robust for reducing prediction flip rates. The stability of Q-Anchored performance in v0.3 implies that model updates prioritized maintaining question-centric reliability over answer-centric adjustments.