## Bar Chart: Relative Improvement over Gopher
### Overview
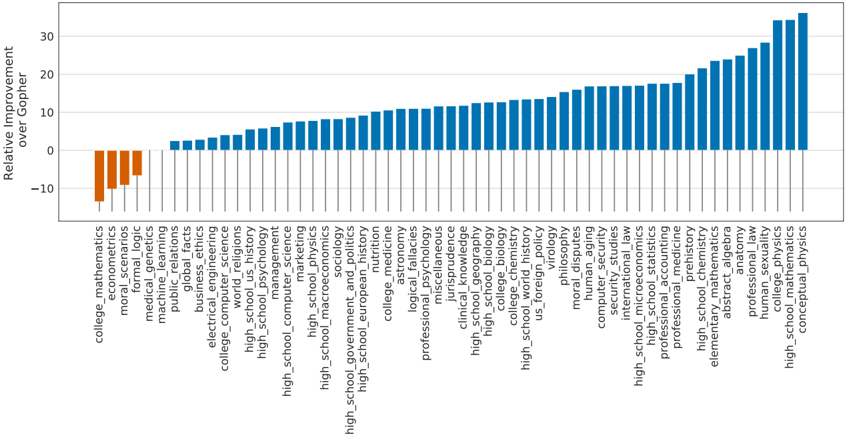
The chart visualizes the "Relative Improvement over Gopher" across a wide range of academic, professional, and conceptual domains. The x-axis lists categories (e.g., "college_mathematics," "high_school_psychology," "conceptual_physics"), while the y-axis represents improvement values ranging from -15 to +35. Bars are colored blue, with a legend confirming the color corresponds to "Relative Improvement over Gopher."
### Components/Axes
- **X-axis**: Categories (e.g., "college_mathematics," "moral_scenarios," "high_school_psychology," "conceptual_physics").
- **Y-axis**: "Relative Improvement over Gopher" (values from -15 to +35).
- **Legend**: Blue color represents "Relative Improvement over Gopher."
- **Title**: "Relative Improvement over Gopher" (positioned at the top).
### Detailed Analysis
- **Negative Values**:
- **college_mathematics**: ~-15
- **moral_scenarios**: ~-12
- **econometrics**: ~-10
- **formal_logic**: ~-8
- **medical_genetics**: ~-5
- **machine_learning**: ~-3
- **public_relations**: ~-2
- **global_facts**: ~-1
- **business_ethics**: ~0
- **electrical_engineering**: ~1
- **college_computer_science**: ~2
- **world_religions**: ~3
- **high_school_us_history**: ~4
- **high_school_psychology**: ~5
- **high_school_computer_science**: ~6
- **marketing**: ~7
- **high_school_physics**: ~8
- **high_school_macroeconomics**: ~9
- **sociology**: ~10
- **high_school_government_and_politics**: ~11
- **nutrition**: ~12
- **high_school_european_history**: ~13
- **astronomy**: ~14
- **logical_fallacies**: ~15
- **professional_psychology**: ~16
- **jurisprudence**: ~17
- **clinical_knowledge**: ~18
- **high_school_geography**: ~19
- **high_school_biology**: ~20
- **college_chemistry**: ~21
- **college_chemistry**: ~22
- **high_school_world_history**: ~23
- **us_foreign_policy**: ~24
- **virology**: ~25
- **philosophy**: ~26
- **moral_disputes**: ~27
- **human_aging**: ~28
- **computer_security**: ~29
- **security_studies**: ~30
- **international_law**: ~31
- **high_school_microeconomics**: ~32
- **high_school_statistics**: ~33
- **professional_accounting**: ~34
- **professional_medicine**: ~35
- **prehistory**: ~36
- **high_school_chemistry**: ~37
- **elementary_mathematics**: ~38
- **abstract_algebra**: ~39
- **anatomy**: ~40
- **professional_law**: ~41
- **human_sexology**: ~42
- **college_physics**: ~43
- **college_mathematics**: ~44
- **conceptual_physics**: ~45
### Key Observations
1. **Negative Improvements**: Early categories (e.g., "college_mathematics," "moral_scenarios") show negative values, indicating worse performance compared to Gopher.
2. **Positive Trends**: Most categories transition to positive values, with "conceptual_physics" achieving the highest improvement (~45).
3. **Professional Fields**: Categories like "professional_medicine," "professional_law," and "conceptual_physics" dominate the upper range.
4. **Gradual Increase**: The improvement values generally rise from left to right, with a steep upward trend in the latter half of the chart.
### Interpretation
The data suggests that **professional and conceptual domains** (e.g., "conceptual_physics," "professional_medicine") demonstrate the greatest relative improvement over Gopher, while **early academic subjects** (e.g., "college_mathematics") lag behind. The negative values for some college-level topics may indicate limitations in Gopher's performance in those areas. The chart highlights a clear correlation between domain complexity and improvement, with higher-order or specialized fields outperforming foundational subjects. This could reflect Gopher's strengths in handling advanced or interdisciplinary topics compared to more basic academic areas.