## 2D Phase Plot: Butterfly-Shaped Trajectory
### Overview
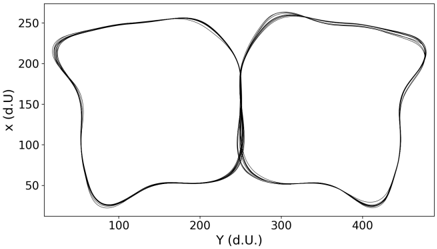
The image displays a 2D line plot showing a complex, closed-loop trajectory that resembles a butterfly or figure-eight shape. The plot consists of multiple overlapping traces, suggesting repeated cycles of a dynamic system. The data is presented in a simple, unadorned scientific style with black lines on a white background.
### Components/Axes
* **Chart Type:** 2D line plot / phase portrait.
* **X-Axis:**
* **Label:** `Y (d.U.)`
* **Scale:** Linear.
* **Range:** Approximately 50 to 450.
* **Major Ticks:** 100, 200, 300, 400.
* **Y-Axis:**
* **Label:** `x (d.U.)`
* **Scale:** Linear.
* **Range:** Approximately 20 to 260.
* **Major Ticks:** 50, 100, 150, 200, 250.
* **Data Series:**
* A single, complex trajectory plotted in black/dark gray.
* The line appears to consist of multiple, very closely overlapping cycles, creating a slightly thickened or shadowed effect in some areas, particularly on the outer curves.
* **Legend:** None present.
* **Title:** None present.
* **Other Text:** None present.
### Detailed Analysis
The trajectory forms two primary lobes connected by a narrow central crossing point.
1. **Left Lobe:**
* Occupies the region where `Y` is between ~50 and ~250.
* The path starts near `(Y=250, x=100)`, sweeps left and down to a minimum `x` of ~20 at `Y`~100, then curves up and right to a maximum `x` of ~250 at `Y`~200, before descending back towards the center.
* The outer boundary of this lobe is smooth and convex.
2. **Central Crossing:**
* The trajectory converges to a narrow vertical band around `Y` = 250.
* Multiple lines pass through this region, creating a dense, dark vertical line from `x`~50 to `x`~150. This is the point where the left and right lobes connect.
3. **Right Lobe:**
* Occupies the region where `Y` is between ~250 and ~450.
* Mirrors the left lobe in shape but is shifted to higher `Y` values.
* The path ascends from the center to a maximum `x` of ~260 at `Y`~300, sweeps right and down to a minimum `x` of ~20 at `Y`~400, then curves back left and up towards the center.
* The outer boundary is also smooth and convex.
**Spatial Grounding & Trend Verification:**
* The overall trend is a **closed, periodic orbit**. The system state (`x`, `Y`) cycles repeatedly through this butterfly-shaped path.
* The line color is consistently black/dark gray throughout. There are no distinct colored series to cross-reference with a legend.
* The slight "fuzziness" or thickness of the line, especially on the outer curves of both lobes, indicates that the plot likely shows **multiple overlaid cycles** of the same trajectory, with minor variations between each cycle.
### Key Observations
1. **Symmetry:** The plot exhibits approximate mirror symmetry about the vertical line `Y = 250`.
2. **Bistability:** The two lobes suggest the system has two semi-stable states or operating regions (one centered around low `Y`, one around high `Y`), with a narrow transition region between them.
3. **Periodicity:** The closed nature of the loops confirms the system's behavior is periodic or oscillatory.
4. **Data Density:** The central crossing point is a region of high data density, indicating the system spends a relatively short amount of time transitioning between the two lobes.
5. **Lack of Context:** The axes are labeled with the generic unit "d.U." (likely "dimensionless units" or "arbitrary units"), and there is no title or legend. This makes specific physical interpretation impossible without external context.
### Interpretation
This plot is characteristic of a **phase portrait** for a nonlinear dynamical system exhibiting **hysteresis** or **bistable oscillations**. The butterfly shape is a classic signature of systems like the Duffing oscillator or certain electronic circuits (e.g., a Chua's circuit) when plotted in a suitable phase space.
* **What it demonstrates:** The system does not settle to a single point (equilibrium) but instead follows a stable, repeating cycle (a limit cycle attractor). The two lobes represent the system oscillating around two different attractors, with the central crossing representing the unstable saddle point between them.
* **Relationship between elements:** The `x` and `Y` variables are coupled. As `Y` increases, `x` first increases then decreases (right lobe), and as `Y` decreases, `x` first decreases then increases (left lobe), creating the loop. The narrow crossing implies a rapid switch between the two behavioral modes.
* **Anomalies/Outliers:** There are no obvious outliers; the trajectory is smooth and consistent. The minor variations between overlaid cycles are expected in a real or simulated noisy system.
* **Underlying Information:** The plot visually encodes the system's **long-term behavior**. An engineer or scientist would use this to identify the type of nonlinearity, estimate parameters, or assess stability. The "d.U." units suggest this is either a normalized model or raw sensor data where the absolute scale is less important than the qualitative shape and relationships.