## System Diagram: Monte Carlo Tree Search for Model Training
### Overview
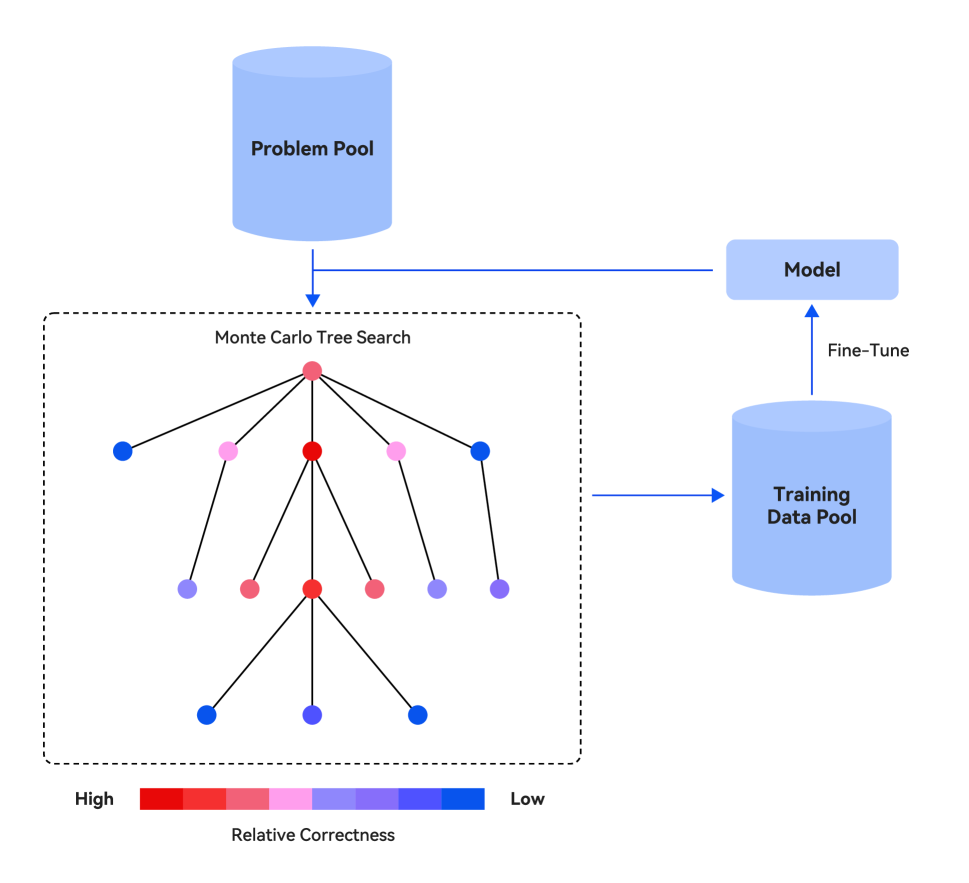
The image presents a system diagram illustrating how a Monte Carlo Tree Search (MCTS) algorithm is used in conjunction with a problem pool, a model, and a training data pool. The diagram depicts the flow of information and the relationships between these components. The MCTS is visualized as a tree structure where node color indicates relative correctness.
### Components/Axes
* **Problem Pool:** A cylindrical container at the top-left, labeled "Problem Pool."
* **Model:** A rectangular box at the top-right, labeled "Model."
* **Training Data Pool:** A cylindrical container at the bottom-right, labeled "Training Data Pool."
* **Monte Carlo Tree Search:** A dashed rectangle in the center containing a tree diagram. The title "Monte Carlo Tree Search" is above the tree.
* **Tree Nodes:** The tree consists of nodes connected by lines. The nodes are colored according to "Relative Correctness."
* **Relative Correctness Color Scale:** A horizontal color gradient bar below the tree, labeled "Relative Correctness." The gradient ranges from red ("High") on the left to blue ("Low") on the right.
* **Arrows:** Arrows indicate the flow of information between the components.
* **Fine-Tune:** An arrow pointing from the "Training Data Pool" to the "Model" is labeled "Fine-Tune."
### Detailed Analysis
* **Problem Pool to MCTS:** An arrow points from the "Problem Pool" to the root node of the "Monte Carlo Tree Search."
* **Model to Training Data Pool:** An arrow points from the "Model" to the "Training Data Pool."
* **MCTS Node Colors:**
* The root node of the tree is red, indicating high relative correctness.
* The second level of nodes contains one red node, two pink nodes, and two purple nodes.
* The third level of nodes contains two red nodes and two blue-purple nodes.
* The fourth level of nodes contains two blue nodes.
* **Color Scale:** The "Relative Correctness" color scale shows a gradient from red (High) to blue (Low). The intermediate colors are pink, light purple, and dark purple.
### Key Observations
* The "Problem Pool" feeds into the "Monte Carlo Tree Search."
* The "Model" is used to generate data for the "Training Data Pool."
* The "Training Data Pool" is used to "Fine-Tune" the "Model."
* The MCTS tree shows a distribution of node correctness, with the root node being the most correct.
* The tree structure suggests an exploration of different solutions, with the color of the nodes indicating the relative correctness of each solution.
### Interpretation
The diagram illustrates a system where a Monte Carlo Tree Search is used to explore solutions from a "Problem Pool." The results of this search are used to train a model. The model is then fine-tuned using a "Training Data Pool," which likely contains data generated or selected based on the MCTS results. The color-coding of the MCTS nodes provides a visual representation of the search process, with red nodes representing more promising solutions and blue nodes representing less promising ones. The system appears to be an iterative process where the model is continuously improved based on the MCTS results. The diagram suggests a reinforcement learning or optimization process where the MCTS guides the model towards better solutions.