\n
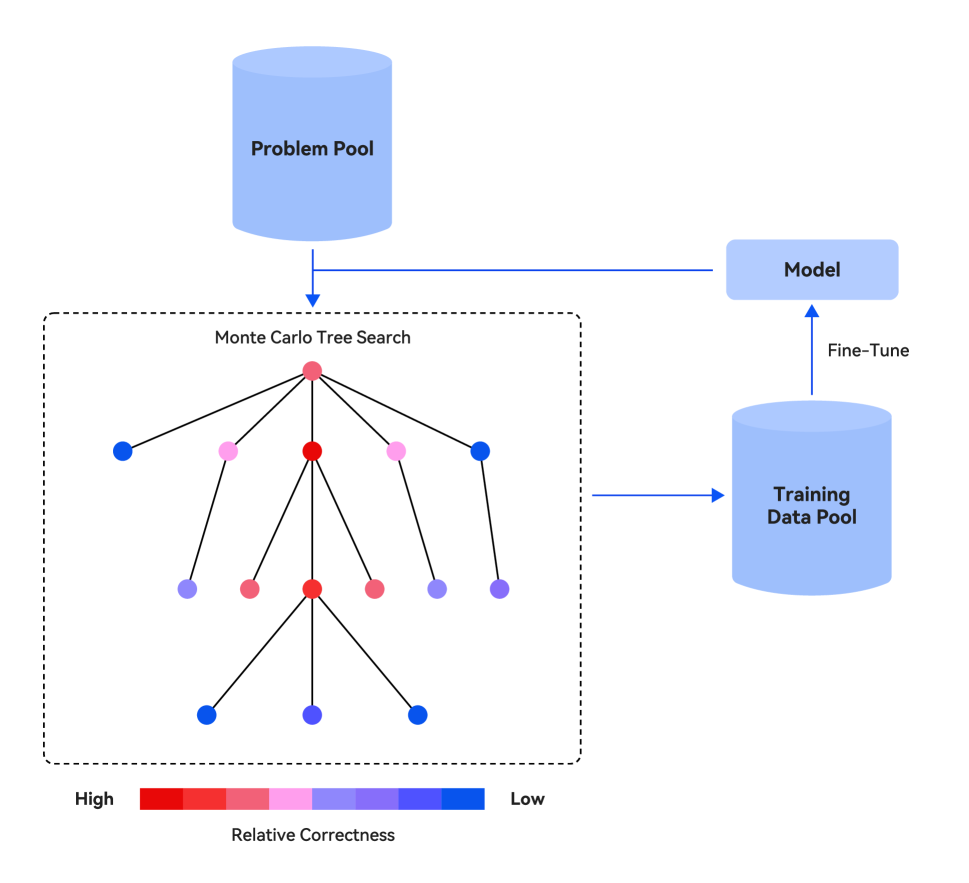
## Diagram: Monte Carlo Tree Search Fine-Tuning Process
### Overview
The image depicts a diagram illustrating a process involving Monte Carlo Tree Search (MCTS) and model fine-tuning. The process begins with a "Problem Pool," utilizes MCTS to generate a "Training Data Pool," and then fine-tunes a "Model" using this data. A color gradient indicates "Relative Correctness" associated with nodes within the MCTS tree.
### Components/Axes
The diagram consists of the following components:
* **Problem Pool:** A cylindrical shape labeled "Problem Pool" at the top of the diagram.
* **Monte Carlo Tree Search:** A dashed-border region labeled "Monte Carlo Tree Search" containing a tree-like structure.
* **Model:** A cylindrical shape labeled "Model" on the right side of the diagram.
* **Training Data Pool:** A cylindrical shape labeled "Training Data Pool" below the "Model".
* **Arrows:** Arrows indicating the flow of data/process between the components.
* **Color Gradient:** A horizontal bar at the bottom labeled "High" to "Low" with a color gradient from red to blue, representing "Relative Correctness".
* **Nodes:** Circular nodes within the MCTS tree, colored according to the "Relative Correctness" gradient.
### Detailed Analysis or Content Details
The MCTS tree is the central element. It appears to be a branching structure, with a root node at the top-center of the dashed box. The nodes are colored as follows (approximate based on visual assessment):
* **Red Nodes:** Approximately 5 nodes, indicating high relative correctness. These are scattered throughout the tree.
* **Pink/Orange Nodes:** Approximately 7 nodes, indicating intermediate relative correctness. These are also scattered throughout the tree.
* **Purple Nodes:** Approximately 4 nodes, indicating lower relative correctness.
* **Blue Nodes:** Approximately 6 nodes, indicating low relative correctness. These are primarily located at the terminal branches of the tree.
The arrows indicate the following flow:
1. From "Problem Pool" to the root of the "Monte Carlo Tree Search".
2. From the "Monte Carlo Tree Search" to the "Training Data Pool".
3. From the "Training Data Pool" to the "Model" with the label "Fine-Tune".
4. From the "Problem Pool" directly to the "Model".
The "Problem Pool" is positioned at the top-center of the diagram. The "Model" is positioned at the top-right. The "Training Data Pool" is positioned at the bottom-right. The MCTS tree occupies the central portion of the diagram. The color gradient is positioned at the very bottom, spanning the width of the diagram.
### Key Observations
The color coding of the MCTS tree suggests that the algorithm explores different solution paths, and assigns a "Relative Correctness" score to each path. The red nodes represent the most promising paths, while the blue nodes represent less promising paths. The direct connection from the "Problem Pool" to the "Model" suggests that the model can also be directly influenced by the initial problem set, in addition to the data generated by the MCTS.
### Interpretation
This diagram illustrates a reinforcement learning or iterative improvement process. The Monte Carlo Tree Search is used to explore a space of possible solutions (problems). The results of this search are used to generate a training dataset, which is then used to fine-tune a model. The color gradient indicates that the MCTS algorithm is able to identify and prioritize more promising solutions. The direct connection from the "Problem Pool" to the "Model" suggests a hybrid approach, where the model is both trained on data generated by the search process and directly informed by the initial problem set. This could be a strategy to accelerate learning or to prevent the model from getting stuck in local optima. The diagram doesn't provide specific data points or numerical values, but it conveys a clear conceptual framework for a machine learning pipeline.