## Flowchart: Machine Learning Pipeline with Monte Carlo Tree Search
### Overview
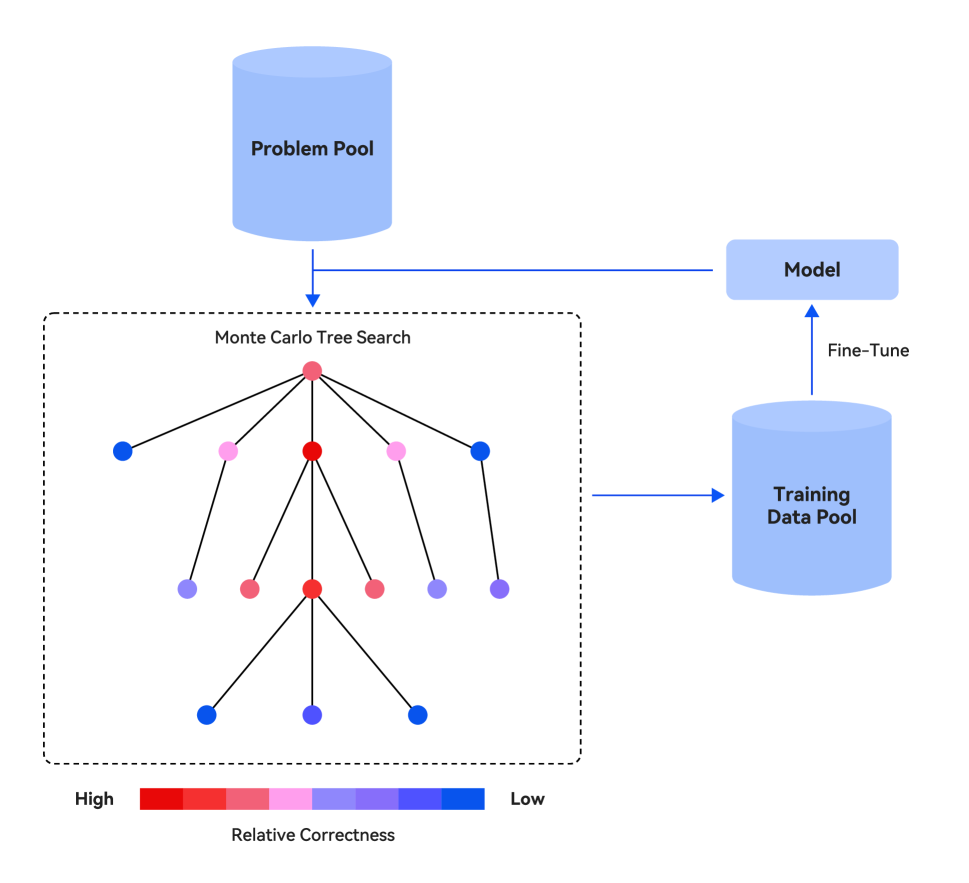
The diagram illustrates a machine learning pipeline integrating a Monte Carlo Tree Search (MCTS) with model training and data refinement. Key components include a Problem Pool, Model, Training Data Pool, and a hierarchical MCTS structure. Color-coded nodes in the MCTS represent relative correctness levels, with feedback loops between components.
### Components/Axes
1. **Problem Pool**: A cylindrical container at the top, feeding into the MCTS.
2. **Model**: A rectangular box connected to the Training Data Pool via a "Fine-Tune" arrow.
3. **Training Data Pool**: A cylindrical container receiving input from the Model.
4. **Monte Carlo Tree Search**: A hierarchical tree structure with nodes colored red (high correctness), pink (medium-high), purple (medium-low), and blue (low correctness). Nodes are connected via black lines, with spatial grounding as follows:
- **Root Node**: Red (highest correctness).
- **First-Level Nodes**: Pink (medium-high correctness).
- **Second-Level Nodes**: Purple (medium-low correctness).
- **Leaf Nodes**: Blue (lowest correctness).
5. **Legend**: Located at the bottom, mapping colors to correctness levels:
- **Red**: High
- **Pink**: Medium-High
- **Purple**: Medium-Low
- **Blue**: Low
### Detailed Analysis
- **Problem Pool → MCTS**: The Problem Pool directly feeds into the MCTS root node (red), initiating the search process.
- **MCTS Hierarchy**:
- The root node (red) branches into four first-level nodes (pink).
- Each pink node branches into three second-level nodes (purple).
- Each purple node branches into three leaf nodes (blue).
- **Feedback Loop**: The Model outputs to the Training Data Pool, which indirectly influences the MCTS via the Problem Pool, creating a cyclical refinement process.
- **Color Consistency**: All node colors strictly align with the legend (e.g., no blue nodes appear above purple nodes in the hierarchy).
### Key Observations
1. **Hierarchical Correctness**: Correctness decreases from root to leaf nodes (red → pink → purple → blue).
2. **Feedback Mechanism**: The "Fine-Tune" arrow indicates iterative model improvement using Training Data Pool outputs.
3. **Structural Symmetry**: The MCTS branches uniformly (4 → 3 → 3 nodes per level), suggesting balanced exploration.
### Interpretation
This diagram represents a closed-loop system where:
- **Problem Pool** provides initial data for the MCTS to explore solutions.
- **MCTS** evaluates solutions hierarchically, with higher correctness nodes (red/pink) likely representing more promising paths.
- **Model Training** refines the system using data from the Training Data Pool, which is enriched by MCTS outputs.
- **Color Gradient**: The red-to-blue gradient visually encodes solution quality, guiding resource allocation (e.g., prioritizing red nodes for further exploration).
The feedback loop emphasizes continuous learning, where model updates improve the Training Data Pool, which in turn enhances the Problem Pool's quality. The uniform branching structure suggests a systematic approach to balancing exploration (diverse paths) and exploitation (high-correctness paths).