## Line Charts: Response Length and Train Reward vs. Step
### Overview
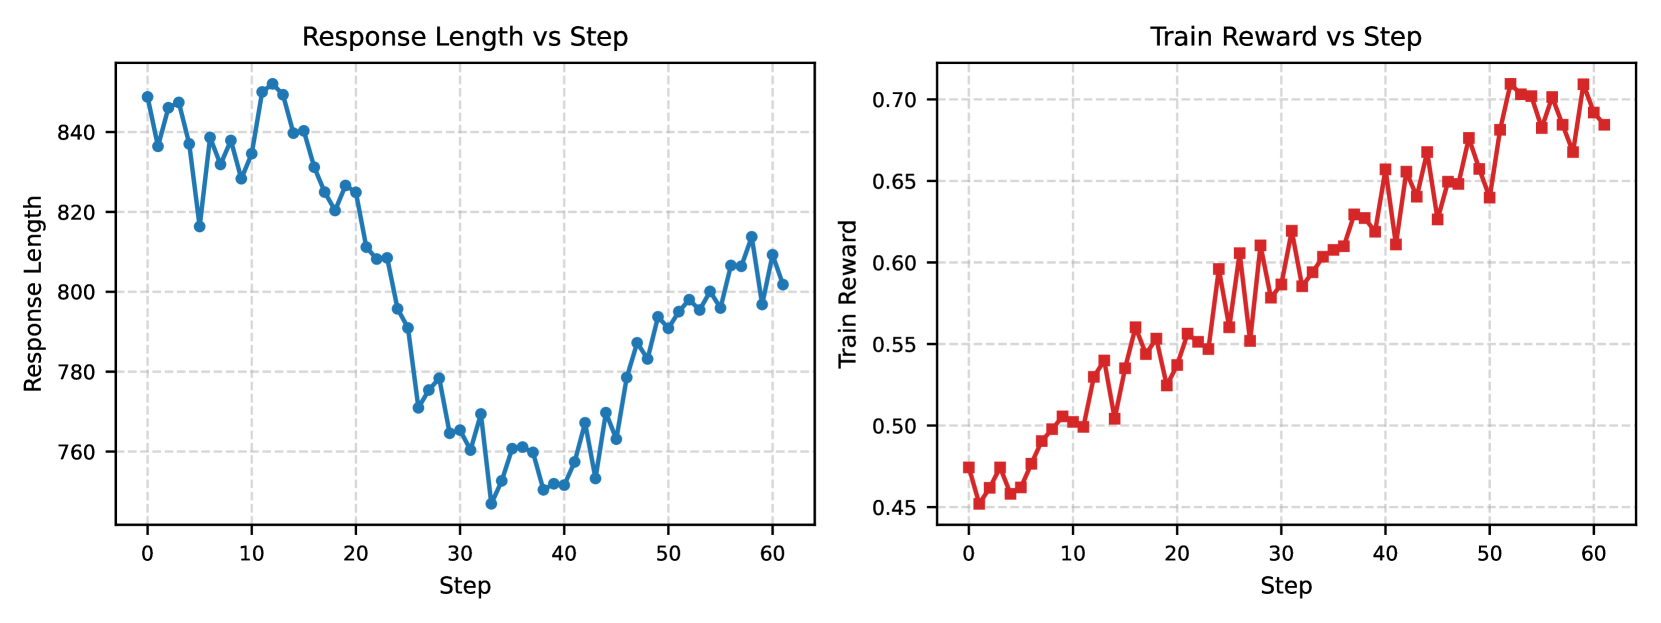
The image contains two line charts displayed side-by-side. The left chart plots "Response Length" against "Step," showing a decreasing trend followed by an increasing trend. The right chart plots "Train Reward" against "Step," showing an overall increasing trend. Both charts share the same x-axis ("Step") ranging from 0 to 60.
### Components/Axes
**Left Chart:**
* **Title:** Response Length vs Step
* **Y-axis:** Response Length, ranging from 760 to 840, with increments of 20.
* **X-axis:** Step, ranging from 0 to 60, with increments of 10.
* **Data Series:** A blue line with circular markers representing the response length at each step.
**Right Chart:**
* **Title:** Train Reward vs Step
* **Y-axis:** Train Reward, ranging from 0.45 to 0.70, with increments of 0.05.
* **X-axis:** Step, ranging from 0 to 60, with increments of 10.
* **Data Series:** A red line with square markers representing the train reward at each step.
### Detailed Analysis
**Left Chart: Response Length vs Step**
* **Trend:** The blue line initially fluctuates between steps 0 and 10, then decreases significantly from approximately step 10 to step 35. After step 35, the line increases again, fluctuating until step 60.
* **Data Points:**
* Step 0: Response Length ≈ 845
* Step 10: Response Length ≈ 835
* Step 20: Response Length ≈ 810
* Step 30: Response Length ≈ 765
* Step 40: Response Length ≈ 750
* Step 50: Response Length ≈ 790
* Step 60: Response Length ≈ 805
**Right Chart: Train Reward vs Step**
* **Trend:** The red line generally increases from step 0 to step 60, with some fluctuations.
* **Data Points:**
* Step 0: Train Reward ≈ 0.47
* Step 10: Train Reward ≈ 0.52
* Step 20: Train Reward ≈ 0.56
* Step 30: Train Reward ≈ 0.60
* Step 40: Train Reward ≈ 0.65
* Step 50: Train Reward ≈ 0.70
* Step 60: Train Reward ≈ 0.69
### Key Observations
* The response length initially decreases and then increases, forming a U-shaped curve.
* The train reward consistently increases over the steps, indicating learning or improvement.
* Both charts share the same x-axis, allowing for a direct comparison of response length and train reward over time (steps).
### Interpretation
The charts suggest a relationship between response length and train reward. Initially, as the training progresses (increasing "Step"), the response length decreases, possibly indicating a more efficient or concise response. However, after a certain point (around step 35), the response length starts to increase again, while the train reward continues to increase. This could indicate that the model is learning to provide more detailed or complex responses, leading to higher rewards. The initial decrease in response length might be due to the model learning to avoid irrelevant information, while the later increase could be due to the model incorporating more relevant details to maximize the reward.