## Charts: Training Performance Metrics
### Overview
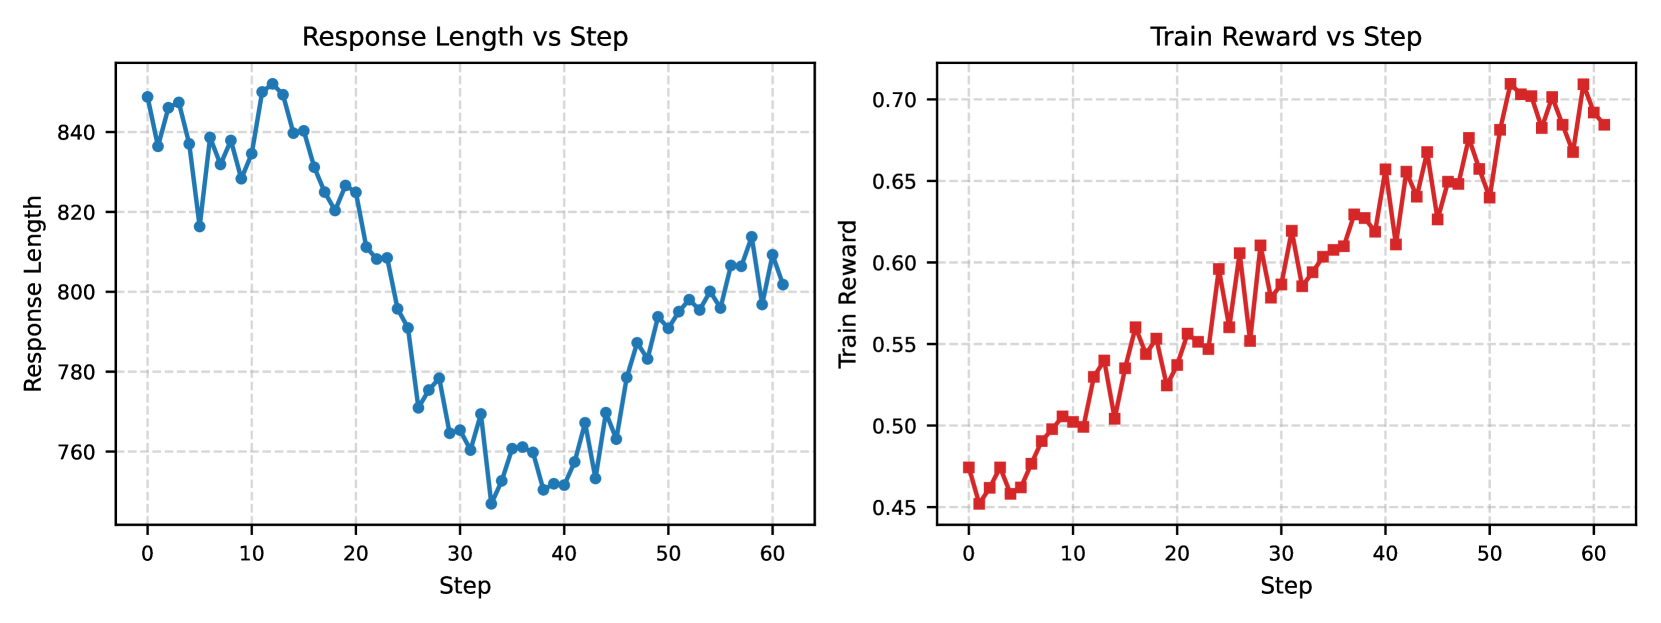
The image presents two line charts displaying training performance metrics over 60 steps. The left chart shows the relationship between "Response Length" and "Step", while the right chart shows the relationship between "Train Reward" and "Step". Both charts share the same x-axis representing "Step".
### Components/Axes
**Chart 1: Response Length vs Step**
* **Title:** Response Length vs Step
* **X-axis:** Step (Scale: 0 to 60, increments of 10)
* **Y-axis:** Response Length (Scale: 740 to 860, increments of 20)
* **Data Series:** Single blue line representing Response Length.
**Chart 2: Train Reward vs Step**
* **Title:** Train Reward vs Step
* **X-axis:** Step (Scale: 0 to 60, increments of 10)
* **Y-axis:** Train Reward (Scale: 0.40 to 0.72, increments of 0.05)
* **Data Series:** Single red line representing Train Reward.
### Detailed Analysis
**Chart 1: Response Length vs Step**
The blue line representing Response Length initially fluctuates around 840 for the first 10 steps. From step 10 to approximately step 25, the line exhibits a steep downward trend, decreasing from roughly 840 to around 750. Between steps 25 and 40, the line shows an upward trend, increasing to approximately 780. From step 40 to 60, the line fluctuates between 780 and 800, showing a relatively stable response length.
* Step 0: Response Length ≈ 845
* Step 10: Response Length ≈ 835
* Step 20: Response Length ≈ 780
* Step 25: Response Length ≈ 750
* Step 30: Response Length ≈ 760
* Step 40: Response Length ≈ 780
* Step 50: Response Length ≈ 790
* Step 60: Response Length ≈ 800
**Chart 2: Train Reward vs Step**
The red line representing Train Reward shows a generally upward trend throughout the 60 steps. The initial increase is relatively slow from step 0 to 10, rising from approximately 0.47 to 0.53. From step 10 to 30, the reward increases more rapidly, reaching around 0.60. Between steps 30 and 60, the reward continues to increase, but with more fluctuations, peaking at approximately 0.71 at step 60.
* Step 0: Train Reward ≈ 0.47
* Step 10: Train Reward ≈ 0.53
* Step 20: Train Reward ≈ 0.58
* Step 30: Train Reward ≈ 0.60
* Step 40: Train Reward ≈ 0.64
* Step 50: Train Reward ≈ 0.68
* Step 60: Train Reward ≈ 0.71
### Key Observations
* Response Length decreases significantly in the early stages of training (steps 10-25) and then stabilizes.
* Train Reward consistently increases throughout the training process, indicating learning.
* The Train Reward curve exhibits more volatility than the Response Length curve, suggesting a more dynamic learning process.
* There appears to be no direct correlation between the Response Length and Train Reward curves.
### Interpretation
These charts likely represent the performance of a reinforcement learning agent or a similar training process. The decreasing Response Length suggests that the agent is learning to be more concise in its responses or actions. The increasing Train Reward indicates that the agent is improving its performance over time, as measured by the reward function. The lack of a clear correlation between the two metrics suggests that conciseness and reward are not necessarily directly linked in this training scenario. The fluctuations in the Train Reward curve could be due to the stochastic nature of the training process or the complexity of the environment. The data suggests that the training process is progressing well, with the agent learning to improve its performance, even if it doesn't necessarily lead to shorter responses.