## Line Charts: Response Length vs Step and Train Reward vs Step
### Overview
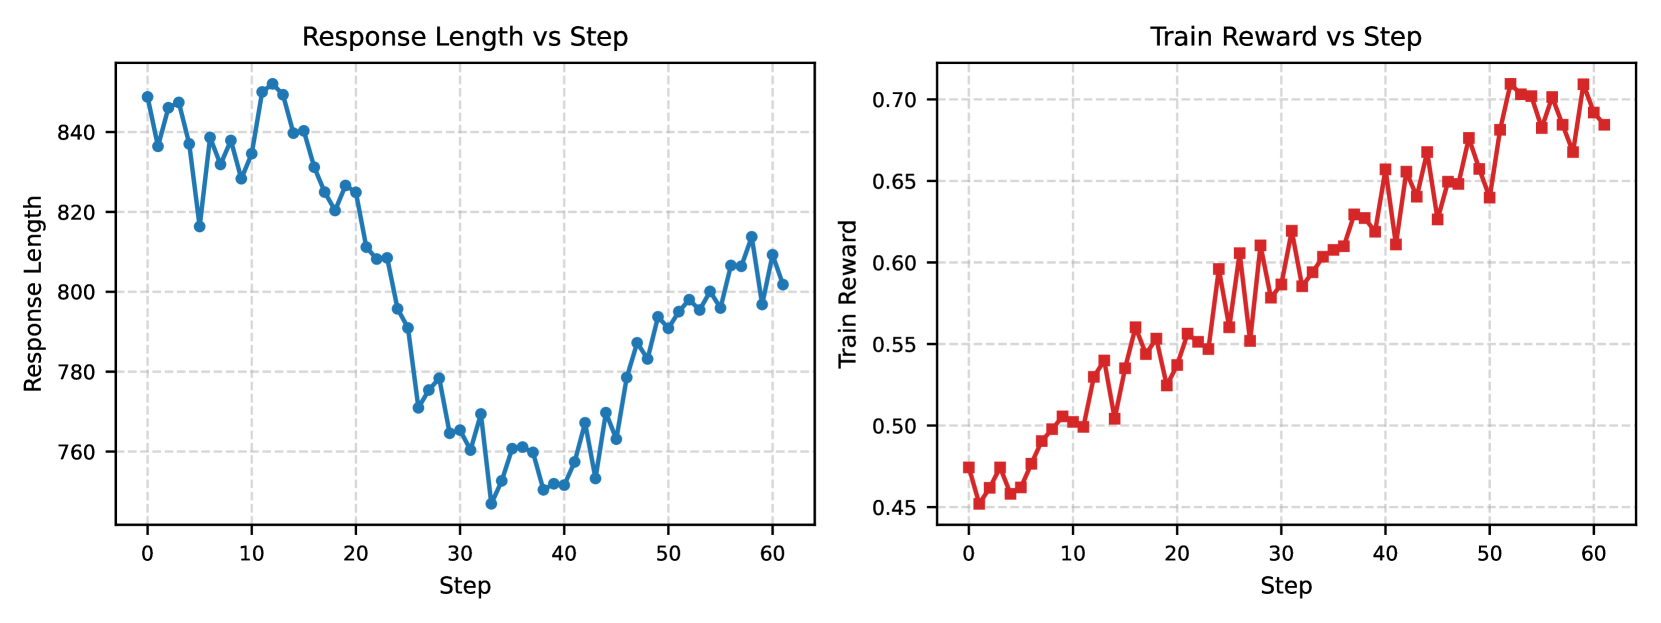
Two line charts are presented side-by-side. The left chart shows "Response Length vs Step" with a blue line, and the right chart shows "Train Reward vs Step" with a red line. Both charts share the same x-axis (Step: 0–60) but have distinct y-axes.
### Components/Axes
- **Left Chart (Response Length vs Step)**:
- **X-axis**: Step (0–60, integer increments).
- **Y-axis**: Response Length (760–850, integer increments).
- **Legend**: Blue line labeled "Response Length" (top-right corner).
- **Right Chart (Train Reward vs Step)**:
- **X-axis**: Step (0–60, integer increments).
- **Y-axis**: Train Reward (0.45–0.70, decimal increments).
- **Legend**: Red line labeled "Train Reward" (top-right corner).
### Detailed Analysis
#### Left Chart (Response Length vs Step)
- **Trend**: The blue line exhibits a U-shaped pattern.
- **Initial Phase (Steps 0–20)**: Starts at ~845, fluctuates between ~830–850, peaking at ~850 around Step 15.
- **Decline Phase (Steps 20–40)**: Drops sharply to a minimum of ~755 at Step 35, then stabilizes around ~760–770.
- **Recovery Phase (Steps 40–60)**: Gradually rises to ~805 by Step 60.
- **Key Data Points**:
- Step 0: ~845
- Step 15: ~850 (peak)
- Step 35: ~755 (trough)
- Step 60: ~805
#### Right Chart (Train Reward vs Step)
- **Trend**: The red line shows a steady upward trajectory with minor fluctuations.
- **Initial Phase (Steps 0–10)**: Starts at ~0.45, rises to ~0.52 by Step 10.
- **Acceleration Phase (Steps 10–50)**: Increases to ~0.65 by Step 50, with oscillations between ~0.60–0.68.
- **Final Phase (Steps 50–60)**: Peaks at ~0.70, then slightly declines to ~0.68 by Step 60.
- **Key Data Points**:
- Step 0: ~0.45
- Step 10: ~0.52
- Step 50: ~0.65
- Step 60: ~0.68
### Key Observations
1. **Response Length**: The U-shaped trend suggests an initial high variability, followed by stabilization and partial recovery.
2. **Train Reward**: Consistent improvement over time, with a 50% increase from Step 0 to Step 60.
3. **Divergence**: The two metrics are inversely related during the decline phase (Steps 20–40), where response length drops while reward rises.
### Interpretation
- The **response length** likely reflects a model’s output complexity or processing time, which initially stabilizes, then optimizes further as training progresses.
- The **train reward** (e.g., accuracy, loss) shows a clear upward trend, indicating effective learning. The divergence between the two metrics during the decline phase suggests a trade-off: reducing response length (e.g., simplifying outputs) may initially harm performance but later aligns with improved rewards as the model refines its strategy.
- The final plateau in response length (~805) and reward (~0.68) implies convergence toward an optimal balance between efficiency and performance.
## Notes
- All legend colors match line placements (blue for response length, red for reward).
- No textual data tables or non-English content are present.
- Spatial grounding: Legends are positioned in the top-right of each chart, ensuring clarity.