## Data Table: HW Defense Performance Overhead
### Overview
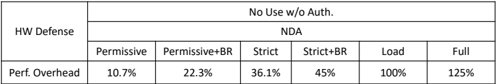
The image presents a data table showing the performance overhead associated with different hardware defense configurations. The table compares various levels of defense, ranging from "Permissive" to "Full," and quantifies the performance impact of each.
### Components/Axes
* **Rows:**
* HW Defense
* Perf. Overhead
* **Columns:**
* No Use w/o Auth.
* NDA
* Permissive
* Permissive+BR
* Strict
* Strict+BR
* Load
* Full
### Detailed Analysis or ### Content Details
The table contains the following data:
| HW Defense | Permissive | Permissive+BR | Strict | Strict+BR | Load | Full |
| --------------- | ---------- | ------------- | ------ | --------- | ------ | ------ |
| Perf. Overhead | 10.7% | 22.3% | 36.1% | 45% | 100% | 125% |
* **Permissive:** Performance overhead is 10.7%.
* **Permissive+BR:** Performance overhead is 22.3%.
* **Strict:** Performance overhead is 36.1%.
* **Strict+BR:** Performance overhead is 45%.
* **Load:** Performance overhead is 100%.
* **Full:** Performance overhead is 125%.
### Key Observations
* The performance overhead increases as the hardware defense becomes more strict.
* The "Load" configuration results in a 100% performance overhead.
* The "Full" configuration results in the highest performance overhead at 125%.
### Interpretation
The data indicates a direct correlation between the level of hardware defense and the performance overhead. As the defense mechanisms become more stringent (from "Permissive" to "Full"), the performance cost increases significantly. This suggests a trade-off between security and performance, where stronger defenses come at the expense of higher overhead. The "Load" and "Full" configurations, with 100% and 125% overhead respectively, may be impractical for systems where performance is critical.