\n
## Diagram: Face Verification Pipeline
### Overview
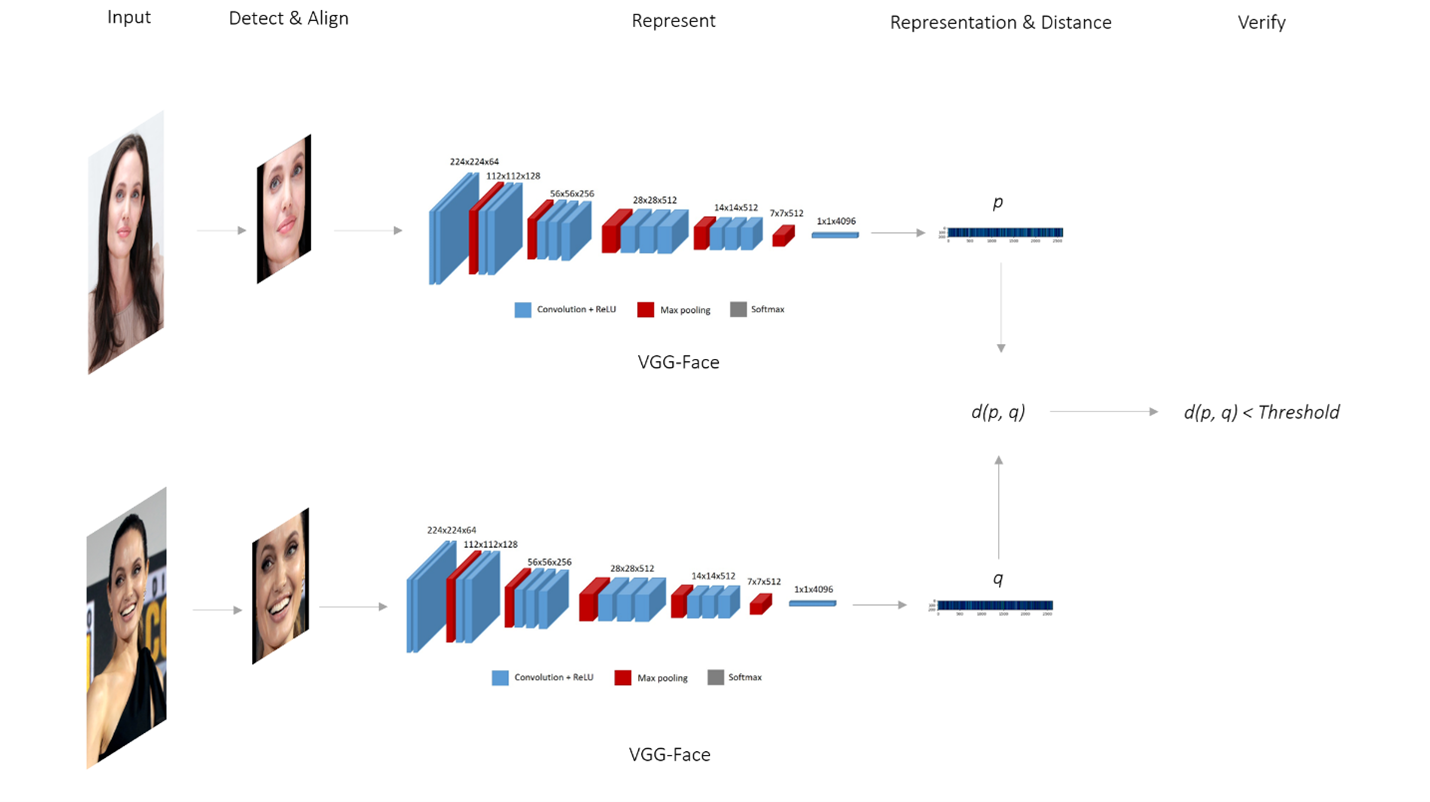
This diagram illustrates a face verification pipeline, showing the steps involved in determining if two face images belong to the same person. The pipeline consists of five stages: Input, Detect & Align, Represent, Representation & Distance, and Verify. The "Represent" stage utilizes a VGG-Face model.
### Components/Axes
The diagram is horizontally organized into five columns labeled: "Input", "Detect & Align", "Represent", "Representation & Distance", and "Verify". The "Represent" stage contains a block labeled "VGG-Face" with internal layers labeled "Convolution + ReLU", "Max pooling", and "Softmax". The dimensions of the layers within VGG-Face are indicated as: 224x224x3, 112x112x128, 56x56x256, 28x28x512, 7x7x512, 1x1x4096. Two face images are processed in parallel through the pipeline. The output of the "Represent" stage are vectors labeled 'p' and 'q'. An arrow connects 'p' and 'q' to a distance calculation 'd(p, q)' which is then compared to a "Threshold".
### Detailed Analysis or Content Details
The pipeline processes two face images.
**Input:** Two grayscale face images are shown. The top image depicts a person with dark hair and the bottom image depicts a person wearing glasses.
**Detect & Align:** Each input image is followed by an arrow indicating a "Detect & Align" step. This step is not detailed visually.
**Represent:** Each aligned face image is then fed into a VGG-Face model. The VGG-Face model consists of the following layers with the specified dimensions:
* Input: 224x224x3
* Convolution + ReLU: 112x112x128
* Max pooling: 56x56x256
* Convolution + ReLU: 28x28x512
* Max pooling: 7x7x512
* Convolution + ReLU: 1x1x4096
* Softmax: Output vector
**Representation & Distance:** The output of the VGG-Face model for each image is represented as a vector. The top image's output is labeled 'p' and the bottom image's output is labeled 'q'. An arrow connects 'p' and 'q' to a distance calculation 'd(p, q)'.
**Verify:** The calculated distance 'd(p, q)' is compared to a "Threshold". The diagram indicates that if 'd(p, q)' is less than the "Threshold", the faces are verified as belonging to the same person.
### Key Observations
The diagram highlights a common approach to face verification using deep learning. The VGG-Face model is used to extract a feature representation of each face, and the distance between these representations is used to determine similarity. The threshold is a critical parameter that determines the sensitivity of the verification process. The diagram does not specify the distance metric used (e.g., Euclidean distance, cosine similarity).
### Interpretation
This diagram demonstrates a typical face verification system. The core idea is to map faces into a high-dimensional feature space using a convolutional neural network (VGG-Face). Faces of the same person should be close together in this space, while faces of different people should be far apart. The distance metric and threshold are chosen to optimize the trade-off between false positives (incorrectly verifying two different people as the same) and false negatives (incorrectly rejecting two images of the same person). The diagram simplifies the process, omitting details such as the training data and the specific architecture of the VGG-Face model. The use of VGG-Face suggests a pre-trained model is being utilized for feature extraction. The diagram focuses on the logical flow of the verification process rather than the implementation details.