## Diagram: VGG-Face Based Facial Recognition Pipeline
### Overview
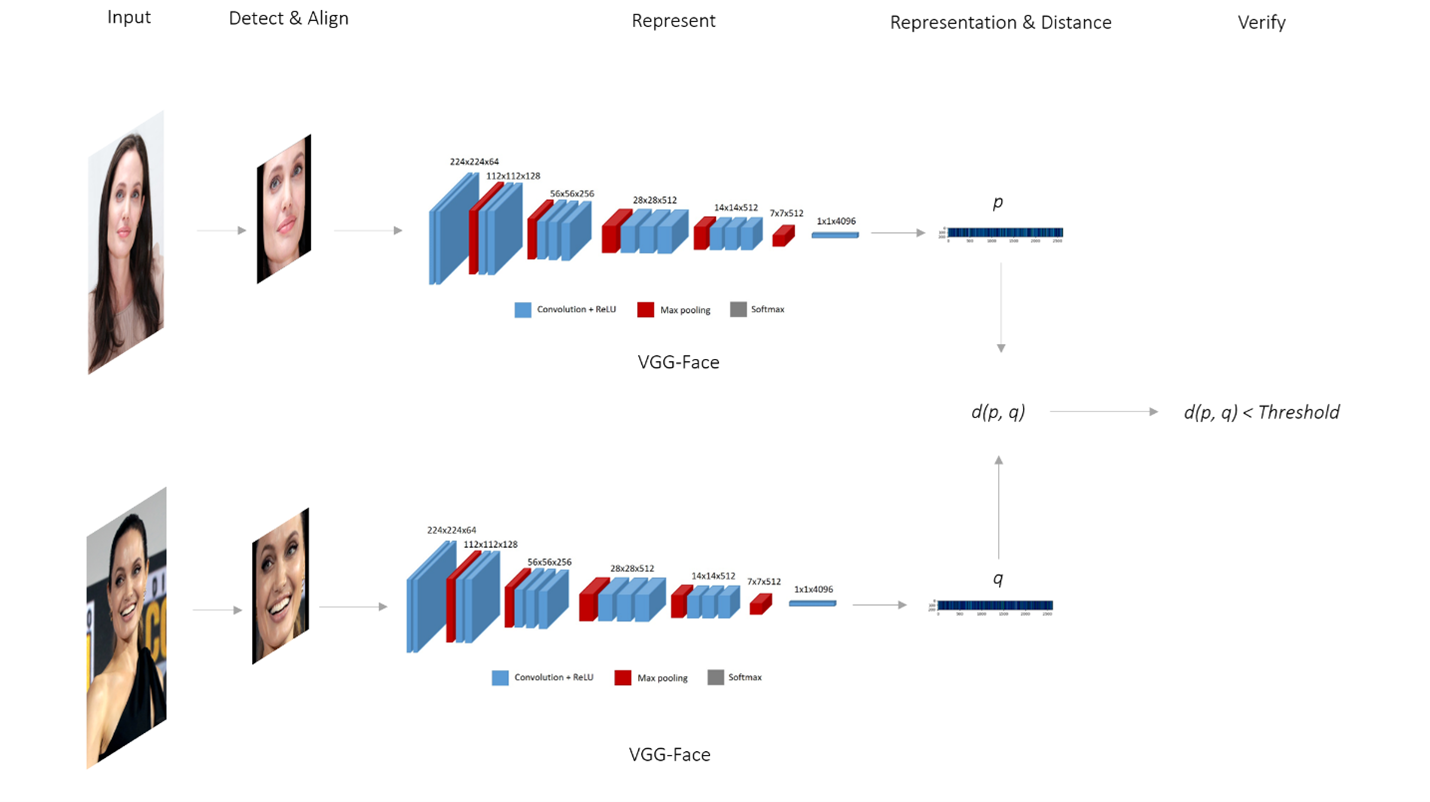
The image is a technical diagram illustrating a two-stream facial recognition system. It shows the complete pipeline from input face images to a verification decision, using the VGG-Face convolutional neural network as the feature extractor. The diagram is divided into two parallel, identical processing streams (top and bottom) that converge at a final comparison step.
### Components/Axes
The diagram is organized horizontally into five labeled stages, indicated by text at the top:
1. **Input**: The starting point for each stream.
2. **Detect & Align**: The face detection and alignment preprocessing step.
3. **Represent**: The feature extraction stage using a deep neural network.
4. **Representation & Distance**: The stage where feature vectors are compared.
5. **Verify**: The final decision stage.
**Legend (appears below each network diagram):**
* **Blue box**: Convolution + ReLU
* **Red box**: Max pooling
* **Grey box**: Softmax
**Neural Network Architecture Labels (VGG-Face):**
The diagram details the layer dimensions for the VGG-Face network in each stream. The sequence of layers and their output dimensions are:
* `224x224x64`
* `112x112x128`
* `56x56x256`
* `28x28x512`
* `14x14x512`
* `7x7x512`
* `1x1x4096`
**Other Text Labels:**
* `VGG-Face` (labeled below each network diagram)
* `p` (feature vector from the top stream)
* `q` (feature vector from the bottom stream)
* `d(p, q)` (distance function between vectors p and q)
* `d(p, q) < Threshold` (verification condition)
### Detailed Analysis
The diagram depicts a symmetric, two-stream process:
**Stream 1 (Top):**
1. **Input**: A photograph of a woman with long brown hair, looking slightly to the side.
2. **Detect & Align**: The output is a cropped and aligned frontal view of the same woman's face.
3. **Represent**: The aligned face is passed through the VGG-Face network. The network is visualized as a series of 3D blocks representing layers. Blue blocks (Convolution + ReLU) are interspersed with red blocks (Max pooling). The spatial dimensions decrease (`224x224` → `112x112` → ... → `7x7`) while the depth (number of channels) increases (`64` → `128` → `256` → `512`). The final layer is a `1x1x4096` fully connected layer (grey, Softmax).
4. **Representation & Distance**: The output of the network is a feature vector labeled `p`, visualized as a horizontal bar with a gradient from blue to red.
**Stream 2 (Bottom):**
This stream is identical in structure to Stream 1 but processes a different input.
1. **Input**: A photograph of a different woman with dark hair, smiling.
2. **Detect & Align**: The output is a cropped and aligned frontal view of this second woman's face.
3. **Represent**: The aligned face goes through an identical VGG-Face network with the same layer dimensions.
4. **Representation & Distance**: The output is a feature vector labeled `q`.
**Convergence and Verification:**
* The two feature vectors, `p` (from top) and `q` (from bottom), are fed into a distance function `d(p, q)`.
* The result of this function is compared to a predefined value: `d(p, q) < Threshold`.
* This comparison leads to the **Verify** stage, implying a binary decision: if the distance is less than the threshold, the faces are verified as a match; otherwise, they are not.
### Key Observations
1. **Symmetry**: The system is perfectly symmetric, processing two inputs through identical pipelines before comparison.
2. **Dimensionality Reduction**: The VGG-Face network clearly shows the progressive reduction of spatial dimensions (from `224x224` to `7x7`) and the increase in feature depth, culminating in a compact 4096-dimensional feature vector.
3. **Abstraction of Complexity**: The complex operations within the "Convolution + ReLU" and "Max pooling" layers are abstracted into colored blocks, focusing the diagram on the data flow and architecture shape.
4. **Decision Logic**: The final verification is presented as a simple mathematical inequality, abstracting away the specific distance metric (e.g., Euclidean, Cosine) and the method for setting the threshold.
### Interpretation
This diagram illustrates a classic **face verification** system (1:1 matching), as opposed to face identification (1:N search). The core principle is to transform raw face images into compact, discriminative numerical representations (embeddings or feature vectors) using a deep neural network (VGG-Face). The system's effectiveness hinges on two key properties:
1. **Invariance**: The network should produce similar vectors (`p` and `q`) for different images of the *same* person, despite variations in lighting, expression, or pose (handled by the "Detect & Align" step and the network's learned features).
2. **Discriminability**: The network should produce dissimilar vectors for images of *different* people.
The distance `d(p, q)` quantifies the dissimilarity between the two face representations. The threshold is a critical operating parameter: a lower threshold makes the system more strict (fewer false matches, more false non-matches), while a higher threshold makes it more lenient. The diagram does not specify the training data or loss function used to teach the VGG-Face network to create these useful representations, which is a fundamental part of the system's real-world performance.