\n
## Diagram: Data Transformation Flow
### Overview
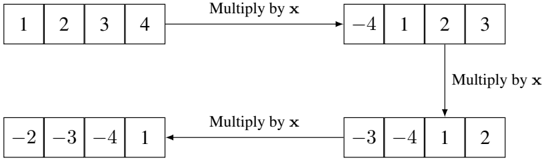
The image depicts a diagram illustrating a data transformation process. Four sets of numbers are shown, connected by arrows labeled "Multiply by x". The diagram demonstrates how a sequence of numbers is modified when multiplied by a variable 'x', and how the result is then used in subsequent transformations.
### Components/Axes
The diagram consists of four rectangular blocks, each containing a sequence of four numbers. Arrows with the label "Multiply by x" connect these blocks, indicating the direction of data flow and the operation performed. There are no axes or scales present.
### Detailed Analysis or Content Details
* **Block 1 (Top-Left):** Contains the sequence: 1, 2, 3, 4.
* **Block 2 (Top-Right):** Contains the sequence: -4, -1, 2, 3. This block is connected to Block 1 by an arrow labeled "Multiply by x".
* **Block 3 (Bottom-Left):** Contains the sequence: -2, -3, -4, 1. This block is connected to Block 2 by an arrow labeled "Multiply by x".
* **Block 4 (Bottom-Right):** Contains the sequence: -3, -4, 1, 2. This block is connected to Block 3 by an arrow labeled "Multiply by x".
The arrows indicate a sequential transformation. The initial sequence (1, 2, 3, 4) is multiplied by 'x' to produce the sequence (-4, -1, 2, 3). This result is then multiplied by 'x' again to produce (-2, -3, -4, 1). Finally, this sequence is multiplied by 'x' to yield (-3, -4, 1, 2).
### Key Observations
The diagram illustrates a series of multiplications by the same variable 'x'. The values within each block change as a result of this multiplication. The specific value of 'x' is not provided, but it can be inferred from the transformation between the blocks. For example, if we assume x = -1, then the first transformation would be: 1 * -1 = -1, 2 * -1 = -2, 3 * -1 = -3, 4 * -1 = -4. This does not match the second block. If we assume x = -2, then the first transformation would be: 1 * -2 = -2, 2 * -2 = -4, 3 * -2 = -6, 4 * -2 = -8. This does not match the second block.
### Interpretation
The diagram demonstrates a mathematical operation applied iteratively to a set of data. The operation is a scalar multiplication by a variable 'x'. The diagram doesn't provide the value of 'x', but it shows how the data changes with each multiplication. The diagram could represent a simplified model of a linear transformation or a step in a more complex algorithm. The lack of a defined 'x' value suggests the diagram is intended to illustrate the *process* of transformation rather than a specific calculation. The diagram is a visual representation of a function or a series of functions applied to a data set.