## Line Charts: Agent Effort Distribution Across Society Sizes
### Overview
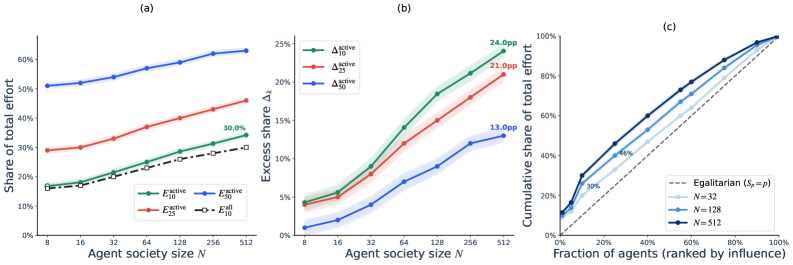
Three line charts analyze how effort distribution and inequality evolve in agent societies of varying sizes (N=8 to 512). Chart (a) shows total effort shares, (b) quantifies excess effort by active agents, and (c) visualizes cumulative effort concentration. All charts use logarithmic scaling on the x-axis for society size.
### Components/Axes
**Chart (a): Share of Total Effort**
- **Y-axis**: Share of total effort (0-60%)
- **X-axis**: Agent society size N (log scale: 8, 16, 32, 64, 128, 256, 512)
- **Legend**:
- Green: E₁₀ (active agents in top 10%)
- Red: E₂₅ (active agents in top 25%)
- Blue: E₅₀ (active agents in top 50%)
- Dashed black: E_all (all agents)
**Chart (b): Excess Share of Total Effort**
- **Y-axis**: Excess share Δ_k (0-25%)
- **X-axis**: Agent society size N (same log scale)
- **Legend**:
- Green: Δ₁₀ (excess by top 10%)
- Red: Δ₂₅ (excess by top 25%)
- Blue: Δ₅₀ (excess by top 50%)
**Chart (c): Cumulative Share of Total Effort**
- **Y-axis**: Cumulative share (0-100%)
- **X-axis**: Fraction of agents ranked by influence (0-100%)
- **Legend**:
- Dashed black: Egalitarian baseline (S_p=p)
- Light blue: N=32
- Dark blue: N=128
- Black: N=512
### Detailed Analysis
**Chart (a) Trends**
- E₅₀ (blue) consistently holds the highest share, rising from 50% (N=8) to 60% (N=512)
- E₂₅ (red) increases from 25% to 45%, while E₁₀ (green) grows from 15% to 30%
- E_all (dashed) remains flat at ~15%, indicating diminishing per-agent contribution in larger societies
**Chart (b) Trends**
- Δ₁₀ (green) shows steepest growth: 4% (N=8) → 24% (N=512)
- Δ₂₅ (red) increases from 5% to 21%, Δ₅₀ (blue) from 1% to 13%
- All excess shares correlate with society size, with top 10% agents driving disproportionate effort
**Chart (c) Trends**
- All N sizes show concave curves, but slope steepness increases with N
- N=512 reaches 98% cumulative share at 40% of agents (most influential), while N=32 requires 80% of agents for same share
- Egalitarian line (dashed) is consistently below real data, highlighting systemic inequality
### Key Observations
1. **Effort Concentration**: Larger societies (N=512) show 3x higher effort share for top 10% agents vs. N=8
2. **Excess Contribution**: Top 10% agents contribute 24% excess effort in N=512 societies (Δ₁₀)
3. **Inequality Magnification**: Cumulative effort curves become steeper with N, deviating further from egalitarian baselines
### Interpretation
The data reveals emergent hierarchical structures in agent societies:
1. **Scaling Dynamics**: As society size grows, effort becomes concentrated in smaller fractions of agents (top 10% in N=512 vs. top 50% in N=8)
2. **Inequality Mechanisms**: The widening gap between E_all (flat line) and active agent shares (E₁₀/E₂₅/E₅₀) suggests diminishing returns for peripheral agents
3. **Power Law Emergence**: Chart (c)'s concave curves mirror real-world power-law distributions, where a small elite controls disproportionate resources
4. **Egalitarian Benchmark**: The persistent deviation from S_p=p indicates inherent systemic biases toward inequality, even in simplified agent models
These patterns align with observed social dynamics in human organizations and animal colonies, where leadership roles and effort concentration scale with group size. The model suggests that decentralized coordination mechanisms may struggle to maintain equitable participation in larger populations.