## Diagram: Maximum and Projection
### Overview
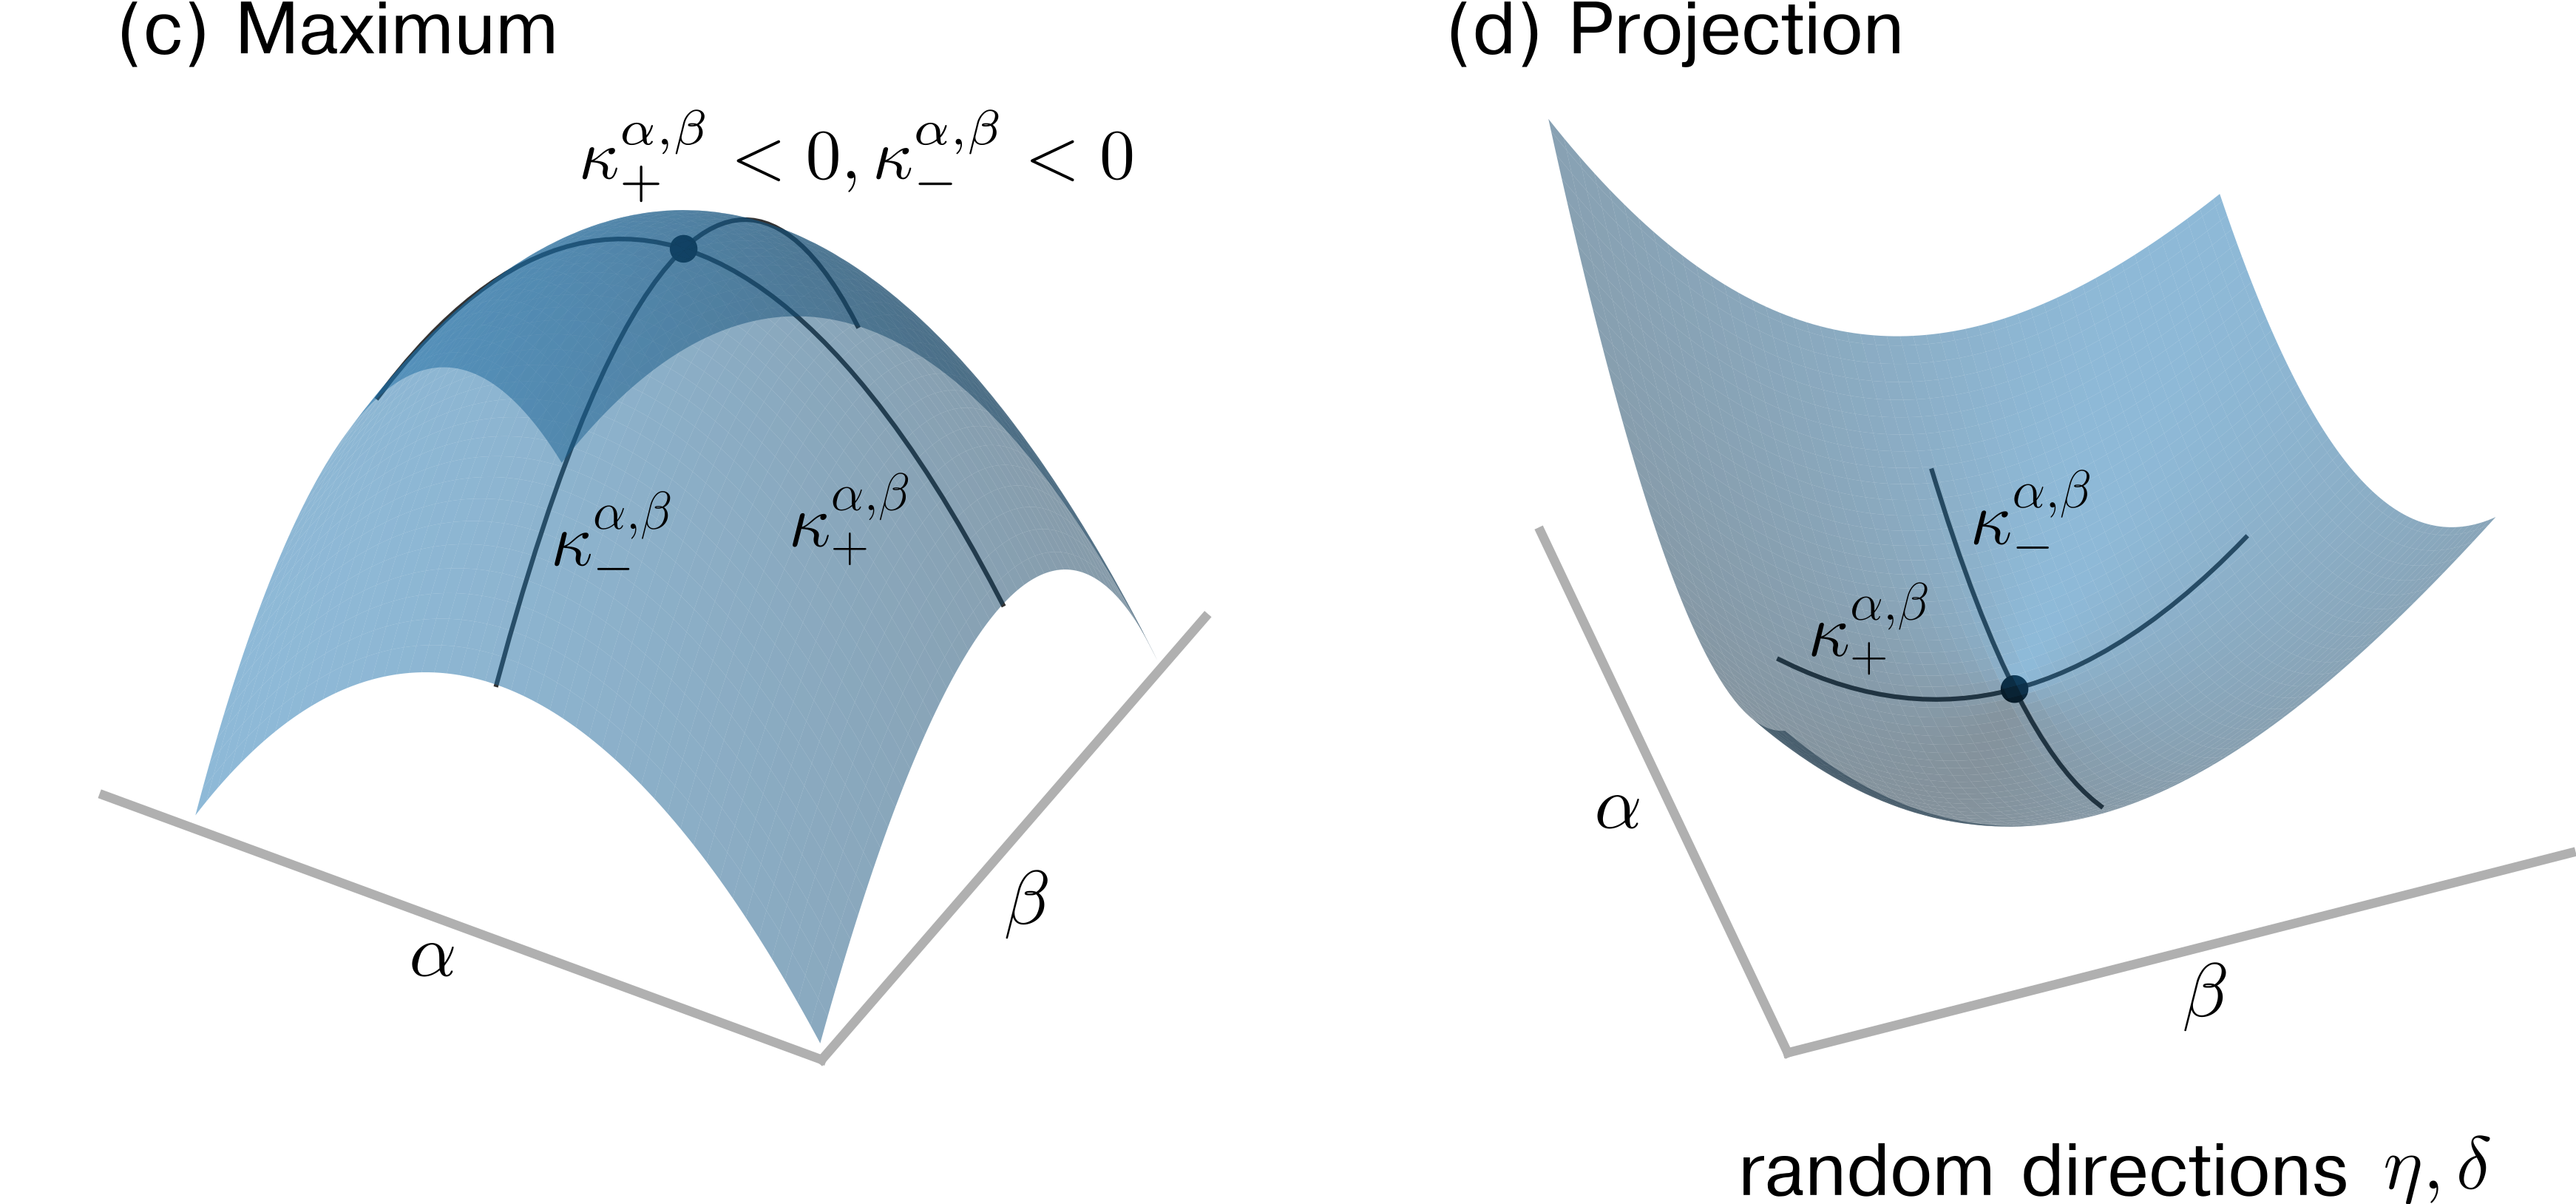
The image presents two 3D surface diagrams, labeled (c) Maximum and (d) Projection. Both diagrams depict surfaces in relation to axes labeled α and β. Diagram (c) shows a surface with a maximum point, while diagram (d) shows a surface with a minimum point. Both diagrams include curves on the surface labeled with κ symbols.
### Components/Axes
**Diagram (c) Maximum:**
* **Title:** (c) Maximum
* **Axes:**
* α (horizontal axis)
* β (axis extending into the page)
* **Surface:** A curved surface with a maximum point. The surface is shaded in varying tones of blue.
* **Curves:** Two curves on the surface, intersecting at the maximum point.
* Curve 1: Labeled "κ₊^(α,β)" near the maximum point.
* Curve 2: Labeled "κ₋^(α,β)" near the maximum point.
* **Inequality:** "κ₊^(α,β) < 0, κ₋^(α,β) < 0" is displayed above the surface.
**Diagram (d) Projection:**
* **Title:** (d) Projection
* **Axes:**
* α (horizontal axis)
* β (axis extending into the page)
* **Surface:** A curved surface with a minimum point. The surface is shaded in varying tones of blue.
* **Curves:** Two curves on the surface, intersecting at the minimum point.
* Curve 1: Labeled "κ₊^(α,β)" near the minimum point.
* Curve 2: Labeled "κ₋^(α,β)" near the minimum point.
* **Text:** "random directions η, δ" is displayed below the diagram.
### Detailed Analysis
**Diagram (c) Maximum:**
* The surface appears to be a section of a paraboloid, opening downwards.
* The maximum point is located at the intersection of the two curves.
* The inequality "κ₊^(α,β) < 0, κ₋^(α,β) < 0" indicates that the curvatures in both directions are negative at the maximum point.
**Diagram (d) Projection:**
* The surface appears to be a section of a paraboloid, opening upwards.
* The minimum point is located at the intersection of the two curves.
* The text "random directions η, δ" suggests that the projection is related to random directions.
### Key Observations
* Both diagrams depict surfaces with critical points (maximum and minimum).
* The curves on the surfaces are labeled with κ symbols, likely representing curvatures.
* The inequality in diagram (c) indicates negative curvatures at the maximum point.
### Interpretation
The diagrams illustrate the concepts of maximum and projection in relation to a surface defined by parameters α and β. The curvatures (κ₊^(α,β) and κ₋^(α,β)) play a role in characterizing the shape of the surface at these critical points. The negative curvatures at the maximum point in diagram (c) are consistent with the surface being concave downwards. Diagram (d) shows the projection of the surface, potentially along random directions η and δ, resulting in a surface with a minimum point. The relationship between the original surface and its projection is not explicitly defined in the image, but it suggests a transformation or mapping of the surface.