\n
## Diagram: Maximum and Projection Surfaces
### Overview
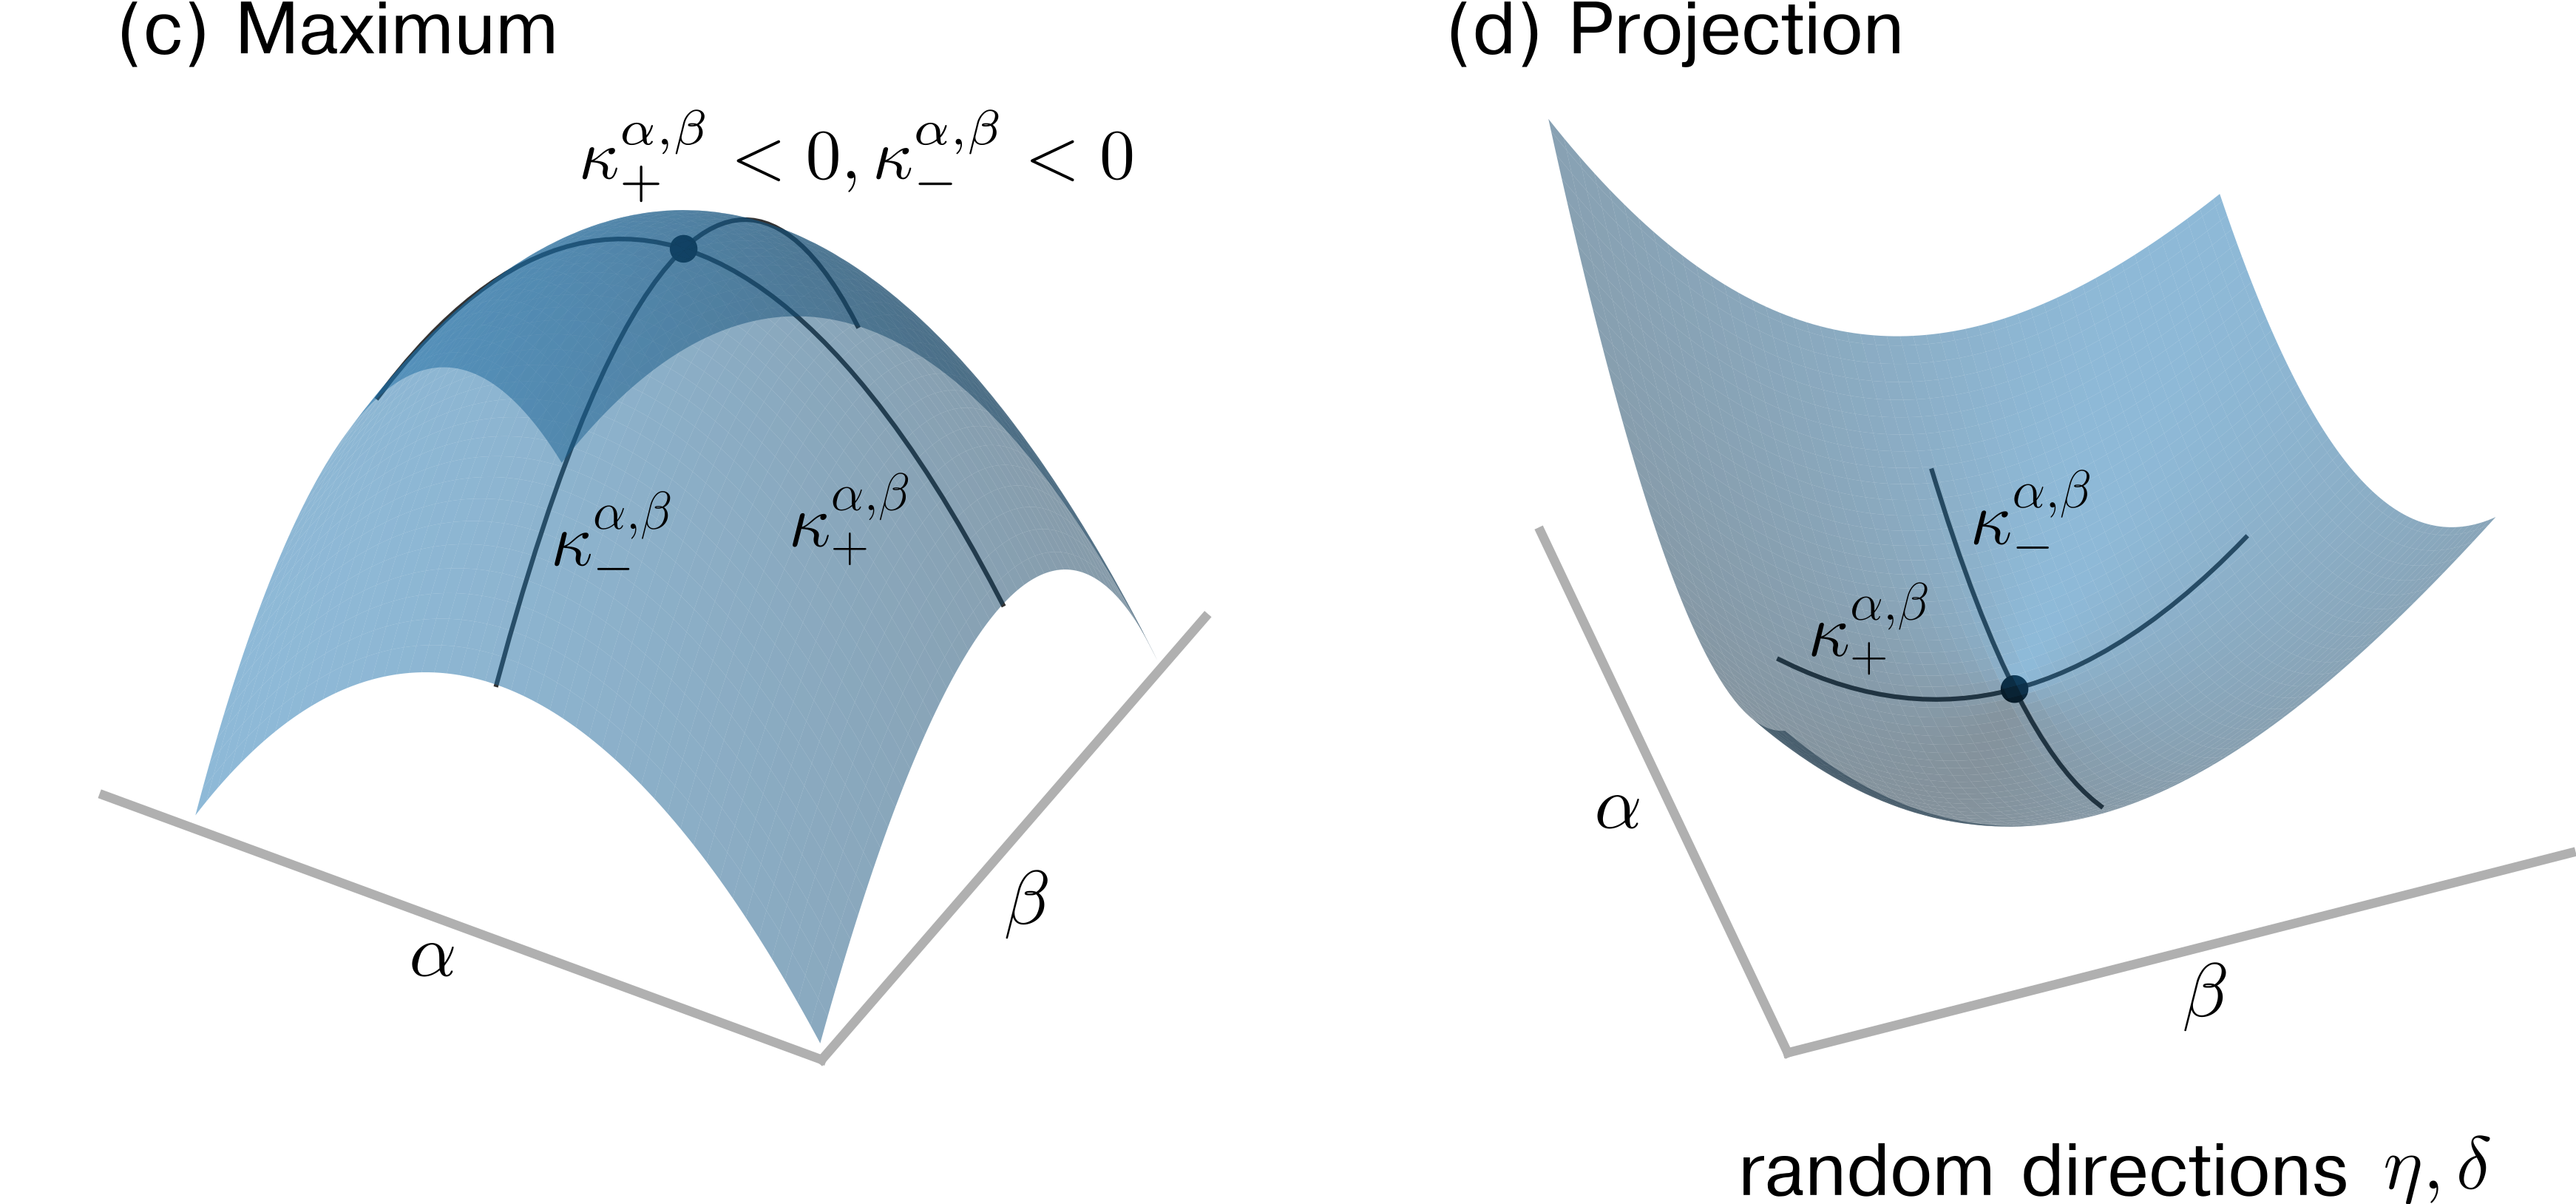
The image presents two 3D diagrams, labeled "(c) Maximum" and "(d) Projection". Both diagrams depict curved surfaces, with labeled axes α and β. The diagram "(c) Maximum" shows a surface with a pronounced peak, and "(d) Projection" shows a surface that extends outwards. Both diagrams feature circular contours and labeled points.
### Components/Axes
* **Diagram (c) Maximum:**
* Axes: α (horizontal), β (horizontal, angled), Z-axis is implicit (vertical).
* Surface: A curved surface resembling a rounded hill or dome. The surface is shaded to indicate depth.
* Contours: Two circular contours are present on the peak of the surface.
* Labels:
* κ⁺<sup>α,β</sup> < 0, κ⁻<sup>α,β</sup> < 0 (above the peak)
* κ⁻<sup>α,β</sup> (pointing to the left contour)
* κ⁺<sup>α,β</sup> (pointing to the right contour)
* **Diagram (d) Projection:**
* Axes: α (vertical), β (horizontal), Z-axis is implicit (depth).
* Surface: A curved surface extending outwards, resembling a hyperbolic paraboloid. The surface is shaded to indicate depth.
* Contours: Two circular contours are present.
* Labels:
* κ⁻<sup>α,β</sup> (pointing to the left contour)
* κ⁺<sup>α,β</sup> (pointing to the right contour)
* Text: "random directions η, δ" (bottom-right)
### Detailed Analysis or Content Details
* **Diagram (c) Maximum:**
* The surface peaks along the β-axis.
* The contours indicate lines of constant value on the surface.
* The labels κ⁺<sup>α,β</sup> and κ⁻<sup>α,β</sup> suggest curvature values. The inequality κ⁺<sup>α,β</sup> < 0, κ⁻<sup>α,β</sup> < 0 indicates that both principal curvatures are negative at the peak, implying a saddle-like point.
* **Diagram (d) Projection:**
* The surface extends outwards from the origin along the β-axis.
* The contours indicate lines of constant value on the surface.
* The labels κ⁺<sup>α,β</sup> and κ⁻<sup>α,β</sup> suggest curvature values. The contours are closer together near the origin, indicating a higher curvature in that region.
* The text "random directions η, δ" suggests that the projection is related to random variables or directions.
### Key Observations
* Both diagrams use the same labels for the curvature values (κ⁺<sup>α,β</sup> and κ⁻<sup>α,β</sup>), suggesting a relationship between the two surfaces.
* The inequality κ⁺<sup>α,β</sup> < 0, κ⁻<sup>α,β</sup> < 0 is only present in diagram (c), indicating a specific property of the "Maximum" surface.
* The "Projection" surface appears to be a projection of the "Maximum" surface onto a different coordinate system.
### Interpretation
These diagrams likely represent mathematical surfaces used in a context involving curvature analysis. The labels κ⁺<sup>α,β</sup> and κ⁻<sup>α,β</sup> likely denote the principal curvatures of the surface in the α-β plane. The inequality in diagram (c) suggests a specific geometric property of the surface at its peak. The "Projection" diagram may represent a transformation or mapping of the "Maximum" surface, potentially related to random variables or directions as indicated by the text. The diagrams are likely part of a larger mathematical or physical model, possibly related to optimization, signal processing, or statistical mechanics. The diagrams demonstrate the concept of curvature and how it changes across a surface, and how a surface can be projected or transformed.