## Charts: Optimal Batch Size vs. Training Time & MSE Improvement
### Overview
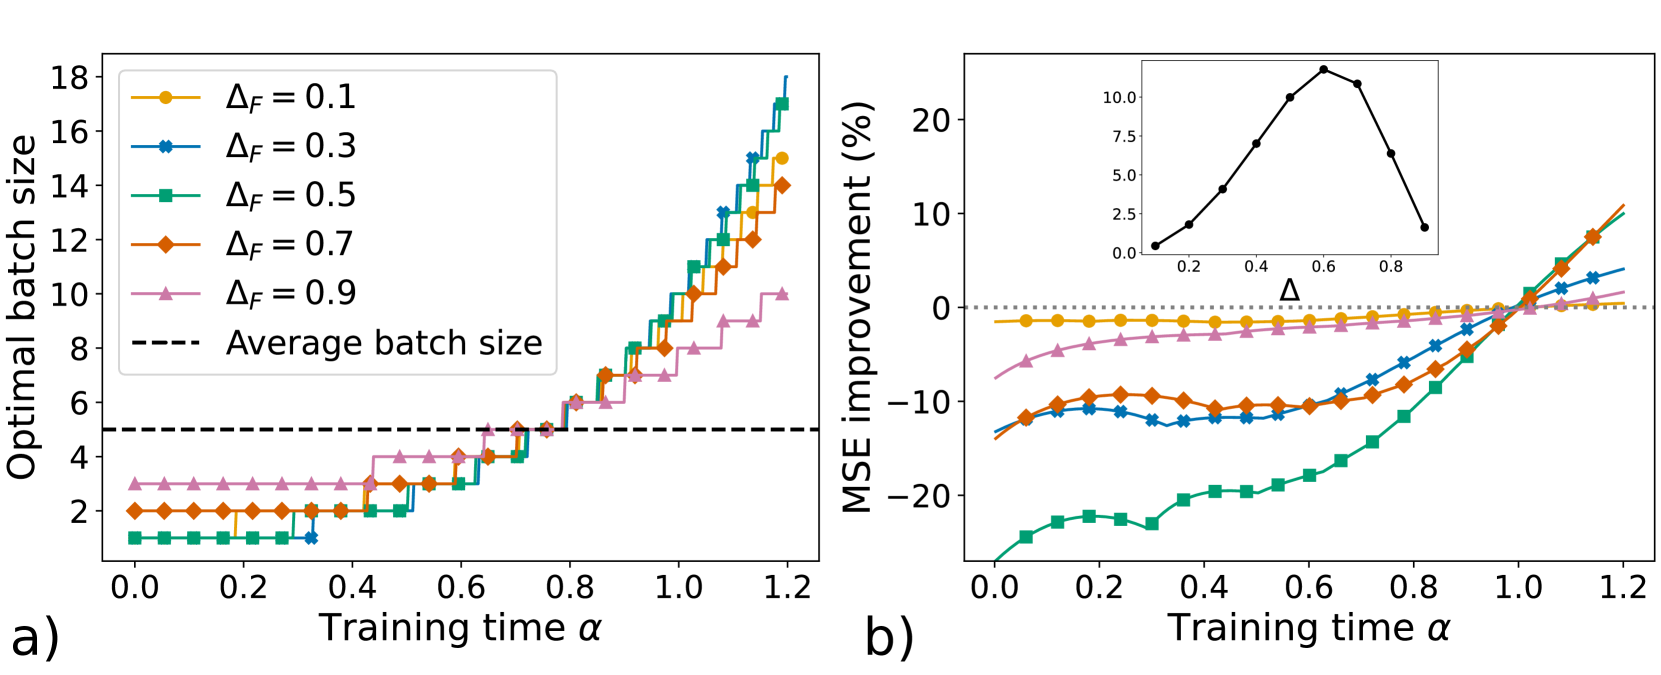
The image presents two charts, labeled 'a)' and 'b)'. Chart 'a)' depicts the relationship between optimal batch size and training time (alpha) for different values of Δf. Chart 'b)' shows the MSE improvement (%) as a function of training time (alpha), also for different Δf values. A small inset chart is present in the top-right corner of chart 'b)', showing MSE improvement as a function of Δ.
### Components/Axes
**Chart a):**
* **X-axis:** Training time α (ranging from approximately 0.0 to 1.2)
* **Y-axis:** Optimal batch size (ranging from approximately 0 to 18)
* **Lines:** Represent different values of Δf: 0.1 (orange), 0.3 (blue), 0.5 (green), 0.7 (red), 0.9 (purple).
* **Dashed Line:** Represents the average batch size (black).
**Chart b):**
* **X-axis:** Training time α (ranging from approximately 0.0 to 1.2)
* **Y-axis:** MSE improvement (%) (ranging from approximately -30 to 25)
* **Lines:** Represent different values of Δf: 0.1 (orange), 0.3 (blue), 0.5 (green), 0.7 (red), 0.9 (purple).
* **Dashed Line:** Represents 0% MSE improvement (black).
**Inset Chart (b):**
* **X-axis:** Δ (ranging from approximately 0.0 to 1.0)
* **Y-axis:** MSE improvement (%) (ranging from approximately 0 to 25)
* **Line:** Represents the relationship between Δ and MSE improvement.
### Detailed Analysis or Content Details
**Chart a):**
* **Δf = 0.1 (orange):** Starts at approximately 2.5 at α = 0.0, increases gradually to approximately 5.5 at α = 0.8, and then rises sharply to approximately 14 at α = 1.2.
* **Δf = 0.3 (blue):** Starts at approximately 2.5 at α = 0.0, increases gradually to approximately 6 at α = 0.8, and then rises sharply to approximately 16 at α = 1.2.
* **Δf = 0.5 (green):** Starts at approximately 3 at α = 0.0, increases gradually to approximately 6 at α = 0.6, and then rises sharply to approximately 17 at α = 1.2.
* **Δf = 0.7 (red):** Starts at approximately 3 at α = 0.0, increases gradually to approximately 5 at α = 0.6, and then rises sharply to approximately 13 at α = 1.2.
* **Δf = 0.9 (purple):** Starts at approximately 3 at α = 0.0, increases gradually to approximately 5 at α = 0.6, and then rises sharply to approximately 12 at α = 1.2.
* **Average Batch Size (black):** Remains relatively constant at approximately 4 across all values of α.
**Chart b):**
* **Δf = 0.1 (orange):** Starts at approximately -5% at α = 0.0, fluctuates around 0% until α = 0.6, and then increases to approximately 10% at α = 1.2.
* **Δf = 0.3 (blue):** Starts at approximately -10% at α = 0.0, fluctuates around -5% until α = 0.6, and then increases to approximately 5% at α = 1.2.
* **Δf = 0.5 (green):** Starts at approximately -25% at α = 0.0, increases rapidly to approximately 0% at α = 0.4, and then continues to increase to approximately 20% at α = 1.2.
* **Δf = 0.7 (red):** Starts at approximately -10% at α = 0.0, increases gradually to approximately 0% at α = 0.6, and then increases to approximately 10% at α = 1.2.
* **Δf = 0.9 (purple):** Starts at approximately -10% at α = 0.0, increases gradually to approximately 0% at α = 0.6, and then increases to approximately 5% at α = 1.2.
**Inset Chart (b):**
* The line peaks at approximately 10% MSE improvement when Δ is approximately 0.5. The improvement decreases as Δ moves away from 0.5 towards 0.0 or 1.0.
### Key Observations
* In Chart a), the optimal batch size increases significantly for all Δf values as training time (α) increases, particularly after α = 0.6.
* In Chart b), the MSE improvement is initially negative for all Δf values, but becomes positive as training time (α) increases.
* Δf = 0.5 shows the most significant MSE improvement in Chart b).
* The inset chart in Chart b) suggests that an intermediate value of Δ (around 0.5) yields the best MSE improvement.
### Interpretation
The data suggests that as training progresses (increasing α), the optimal batch size needs to be increased to maintain performance. The value of Δf influences both the optimal batch size and the rate of MSE improvement. A Δf of 0.5 appears to be particularly effective in achieving significant MSE improvement during training. The inset chart indicates that there is an optimal value for Δ, and deviating from this value leads to reduced performance gains. This could be related to the trade-off between exploration and exploitation during the training process. A higher Δf might allow for more exploration, while a lower Δf might focus on exploitation. The optimal balance appears to be around Δf = 0.5. The average batch size remaining constant suggests it is not dynamically adjusted during training, while the optimal batch size is. This implies that a dynamic batch size adjustment strategy, guided by the value of Δf, can lead to better performance.