## Diagram: Dependency Graph with Formulaic Relationships
### Overview
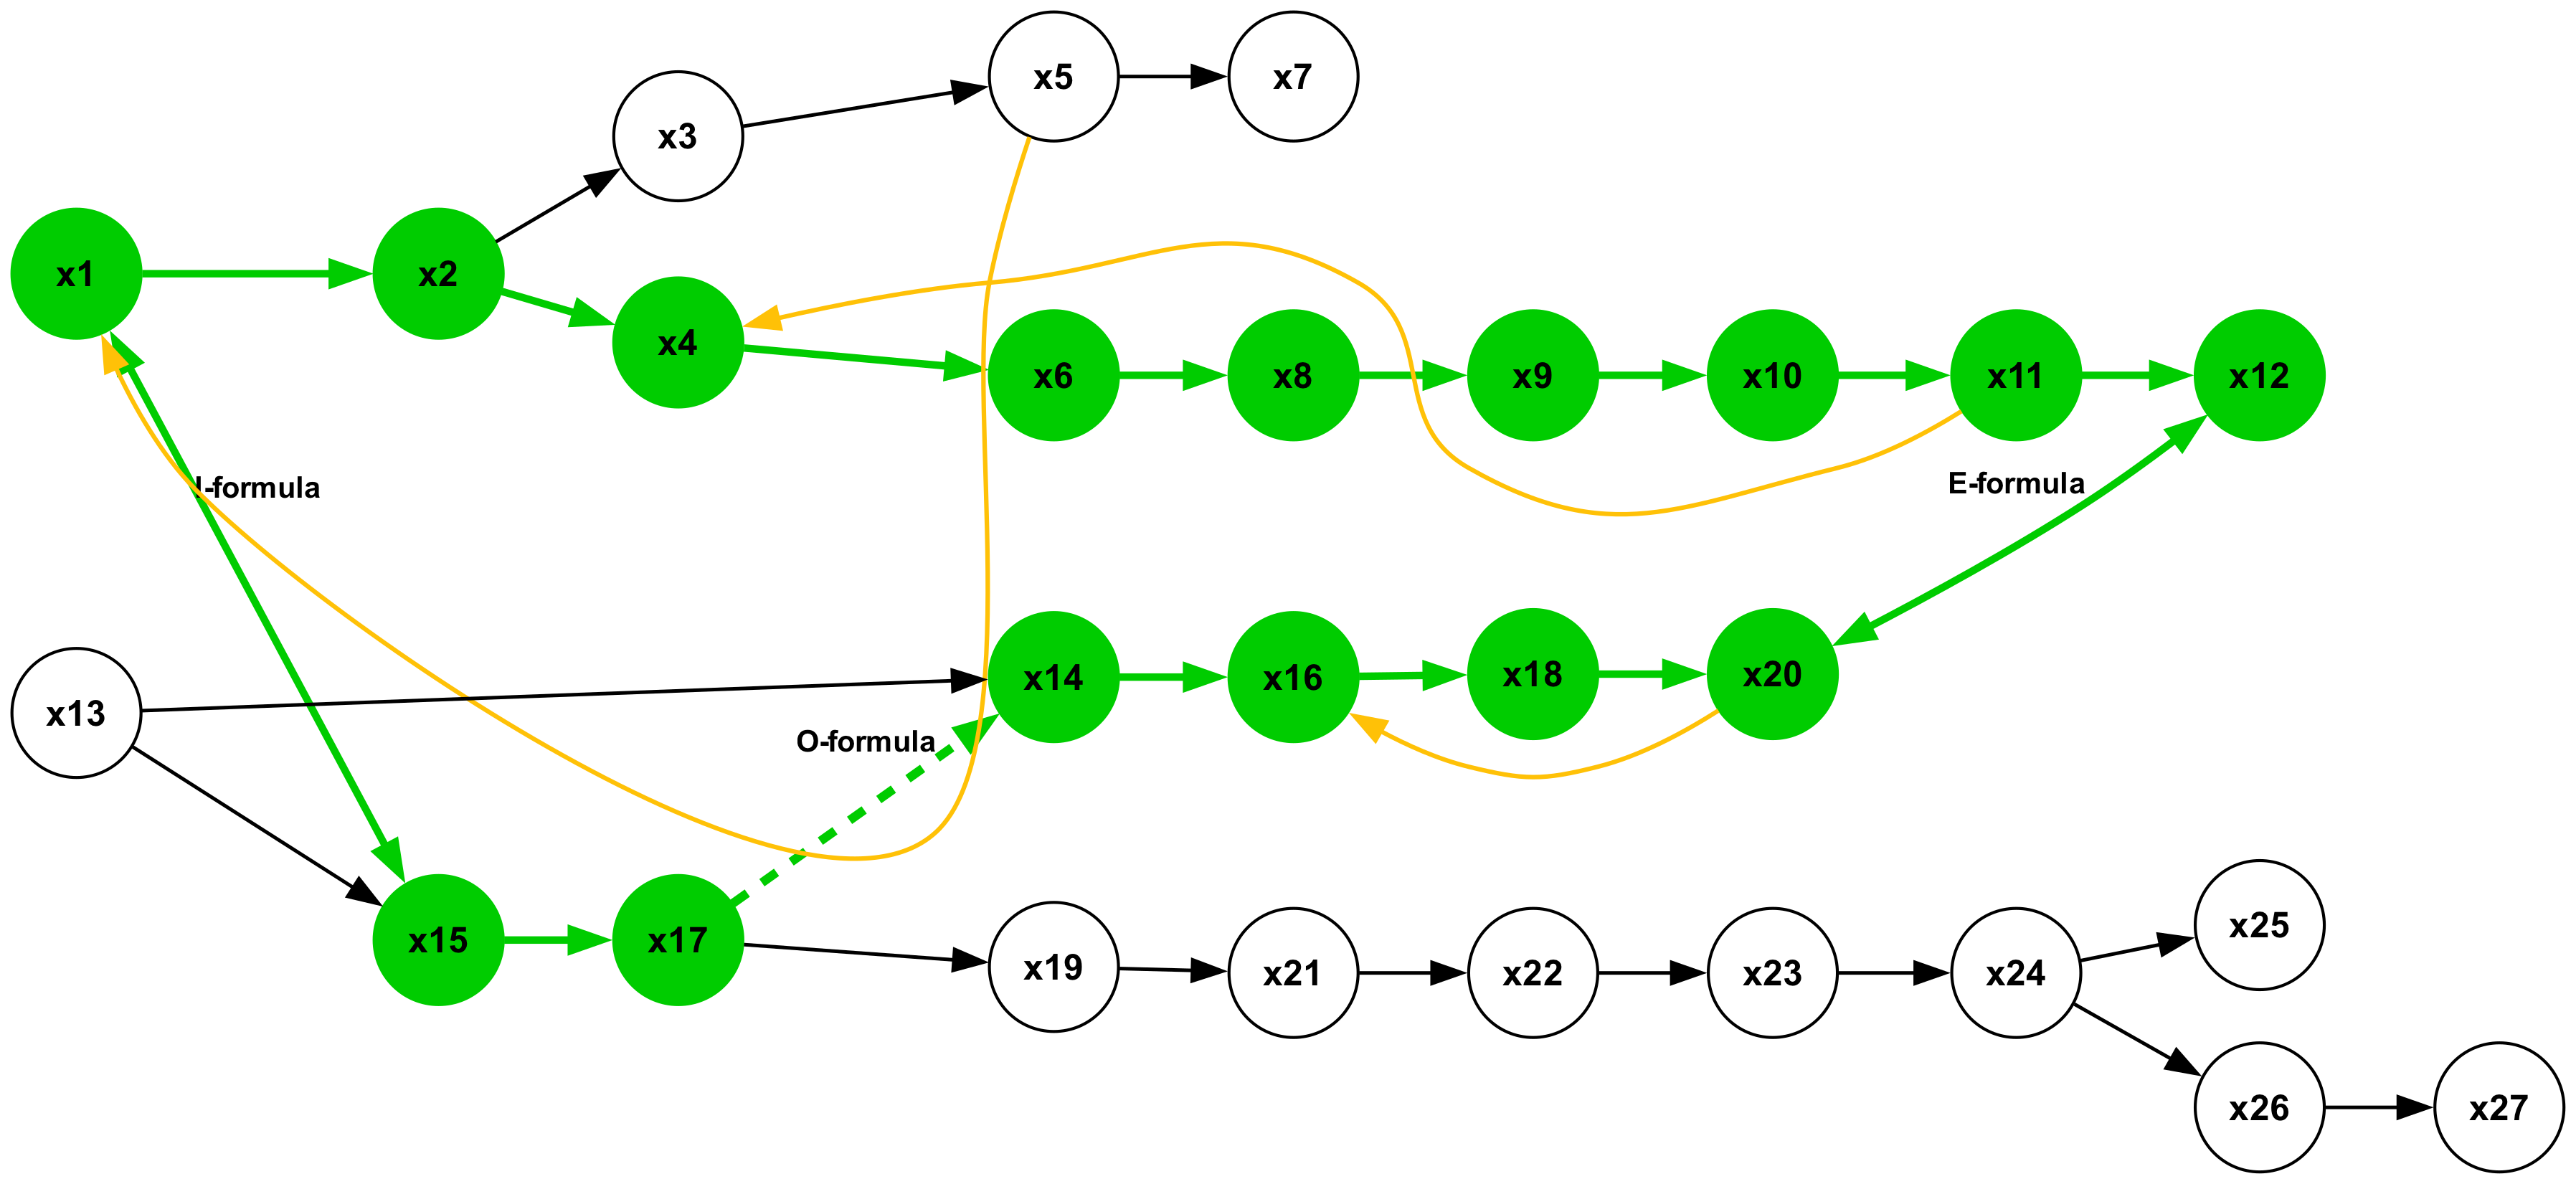
The image is a directed graph representing dependencies between variables, labeled x1 through x27. Nodes are circles, and edges are arrows indicating the direction of dependency. Some edges are colored green, black, or gold, representing different types of relationships, including formulas labeled "I-formula", "E-formula", and "O-formula". Some nodes are filled with green, while others are white.
### Components/Axes
* **Nodes:** Represented by circles labeled x1, x2, x3, ..., x27.
* **Edges:** Represented by arrows indicating dependencies.
* Green arrows: Represent a standard dependency.
* Black arrows: Represent a standard dependency.
* Gold arrows: Represent a dependency related to a specific formula.
* Dashed Green Arrow: Represents a dependency related to the "O-formula".
* **Node Fill Color:**
* Green fill: Indicates a specific state or type of variable.
* White fill: Indicates a different state or type of variable.
* **Formulas:**
* I-formula: Located between x1, x13, and x15.
* E-formula: Located between x20 and x12.
* O-formula: Located between x17 and x14.
### Detailed Analysis or Content Details
* **Node x1:** Filled green. Has outgoing green edges to x2 and x15. Has an outgoing gold edge to x14.
* **Node x2:** Filled green. Has outgoing green edges to x4.
* **Node x3:** White fill. Has an outgoing black edge to x5.
* **Node x4:** Filled green. Has an outgoing green edge to x6.
* **Node x5:** White fill. Has an outgoing black edge to x7. Has an outgoing gold edge to x8.
* **Node x6:** Filled green. Has an outgoing green edge to x8.
* **Node x7:** White fill.
* **Node x8:** Filled green. Has an outgoing green edge to x9.
* **Node x9:** Filled green. Has an outgoing green edge to x10. Has an outgoing gold edge to x12.
* **Node x10:** Filled green. Has an outgoing green edge to x11.
* **Node x11:** Filled green. Has an outgoing green edge to x12.
* **Node x12:** Filled green.
* **Node x13:** White fill. Has an outgoing black edge to x15.
* **Node x14:** Filled green. Has an outgoing green edge to x16.
* **Node x15:** Filled green. Has an outgoing green edge to x17.
* **Node x16:** Filled green. Has an outgoing green edge to x18. Has an outgoing gold edge to x20.
* **Node x17:** Filled green. Has an outgoing black edge to x19. Has an outgoing dashed green edge to x14.
* **Node x18:** Filled green. Has an outgoing green edge to x20.
* **Node x19:** White fill. Has an outgoing black edge to x21.
* **Node x20:** Filled green. Has an outgoing green edge to x12.
* **Node x21:** White fill. Has an outgoing black edge to x22.
* **Node x22:** White fill. Has an outgoing black edge to x23.
* **Node x23:** White fill. Has an outgoing black edge to x24.
* **Node x24:** White fill. Has outgoing black edges to x25 and x26.
* **Node x25:** White fill.
* **Node x26:** White fill. Has an outgoing black edge to x27.
* **Node x27:** White fill.
### Key Observations
* The graph has three distinct "formula" relationships: I-formula, E-formula, and O-formula.
* Nodes x1, x2, x4, x6, x8, x9, x10, x11, x12, x14, x15, x16, x17, x18, and x20 are filled green, while the rest are white.
* The graph shows multiple paths and dependencies, with some nodes influencing others through direct and indirect connections.
* The gold edges create feedback loops or dependencies that bypass the main sequential flow.
### Interpretation
The diagram represents a complex system of dependencies, potentially in a computational process or a model. The green-filled nodes might represent active or processed variables, while the white-filled nodes could represent input or unprocessed variables. The formulas (I, E, and O) likely represent specific calculations or transformations applied within the system. The gold edges indicate feedback loops or dependencies where the output of one process influences an earlier stage. The dashed green line indicates a conditional dependency. The graph suggests a multi-stage process with interconnected components and feedback mechanisms.