\n
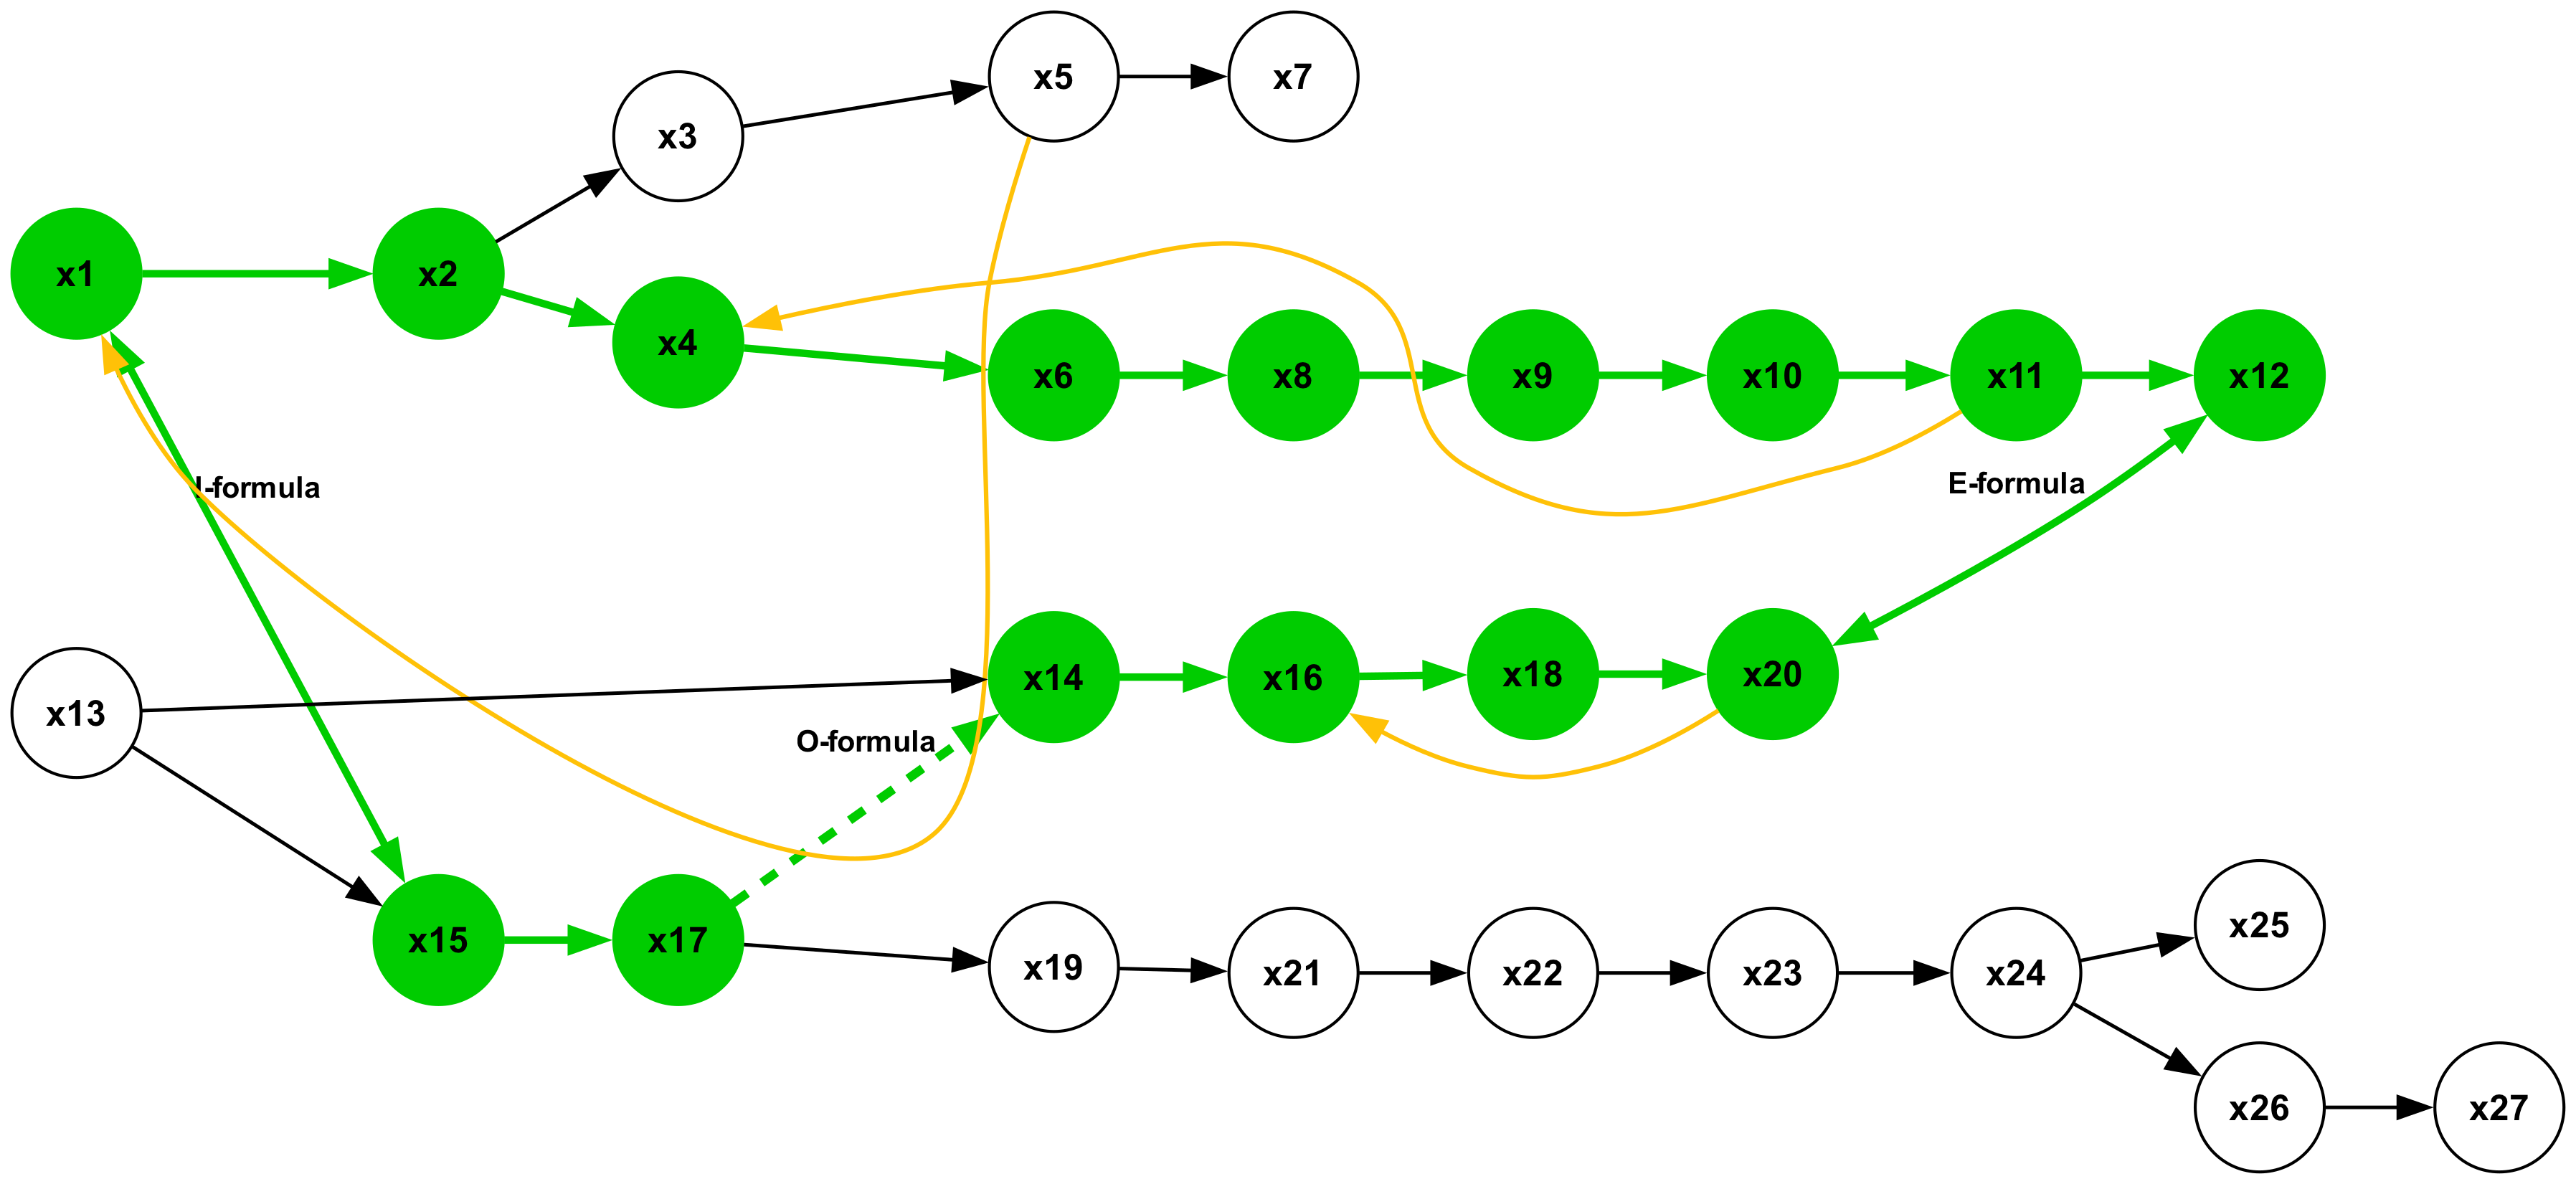
## Diagram: Process Flow with Formulas
### Overview
The image depicts a directed graph representing a process flow with 27 nodes labeled 'x1' through 'x27'. The nodes are interconnected by directed edges (arrows) indicating the flow of the process. Three formulas, 'I-formula', 'E-formula', and 'O-formula', are annotated along specific paths within the graph. The nodes are either green (representing a starting or intermediate point) or white (representing intermediate points).
### Components/Axes
The diagram consists of:
* **Nodes:** 27 circular nodes labeled x1 to x27.
* **Edges:** Directed arrows connecting the nodes, representing the flow of the process. The edges are colored yellow and green.
* **Formulas:** Text labels "I-formula", "E-formula", and "O-formula" associated with specific paths.
### Detailed Analysis or Content Details
The diagram can be broken down into sections based on the starting nodes:
**Section 1: Starting from x1**
* x1 (Green) -> x2 (White) -> x3 (White) -> x5 (Green) -> x7 (White)
* x1 (Green) -> x2 (White) -> x4 (Green) -> x6 (Green) -> x8 (White) -> x9 (White) -> x10 (White) -> x11 (White) -> x12 (White)
* x1 (Green) -> x13 (White) -> x15 (Green) -> x19 (White) -> x21 (White) -> x22 (White) -> x23 (White) -> x24 (White) -> x25 (White) -> x26 (White) -> x27 (White)
**Section 2: Starting from x13**
* x13 (White) -> x14 (Green) -> x16 (Green) -> x18 (White) -> x20 (White)
**Section 3: Connections between sections**
* x4 (Green) -> x8 (White)
* x6 (Green) -> x14 (Green) (dashed line labeled "O-formula")
* x17 (Green) -> x19 (White)
* x15 (Green) -> x17 (Green)
**Formula Annotations:**
* "I-formula" is associated with the path x1 -> x2 -> x4.
* "E-formula" is associated with the path x6 -> x8 -> x9 -> x10 -> x11 -> x12.
* "O-formula" is associated with the path x6 -> x14 (dashed line).
### Key Observations
* The diagram represents a branching process with multiple paths.
* The green nodes appear to represent either starting points or points where multiple paths converge.
* The formulas suggest that specific calculations or transformations are applied along those paths.
* The dashed line for "O-formula" indicates a potentially different or less common path.
* The diagram is not symmetrical; some nodes have more incoming or outgoing connections than others.
### Interpretation
The diagram likely represents a workflow or a series of operations. The nodes (x1-x27) represent states or steps in the process, and the arrows indicate the transitions between these states. The formulas ("I-formula", "E-formula", "O-formula") suggest that certain calculations or transformations are applied at specific points in the process. The use of green nodes to highlight starting points or key decision points suggests that these nodes are particularly important.
The branching nature of the diagram indicates that the process can take different paths depending on certain conditions or inputs. The "O-formula" path, indicated by a dashed line, may represent an alternative or exception handling path. The diagram could be used to visualize a complex algorithm, a manufacturing process, or a software system.
Without further context, it is difficult to determine the exact meaning of the diagram. However, the visual representation provides a clear overview of the process flow and the relationships between its different components. The diagram is a high-level representation and does not provide details about the specific operations performed at each node. It is a conceptual model of a process, rather than a detailed implementation plan.