## Directed Graph Diagram: State Transition Network with Feedback Loops
### Overview
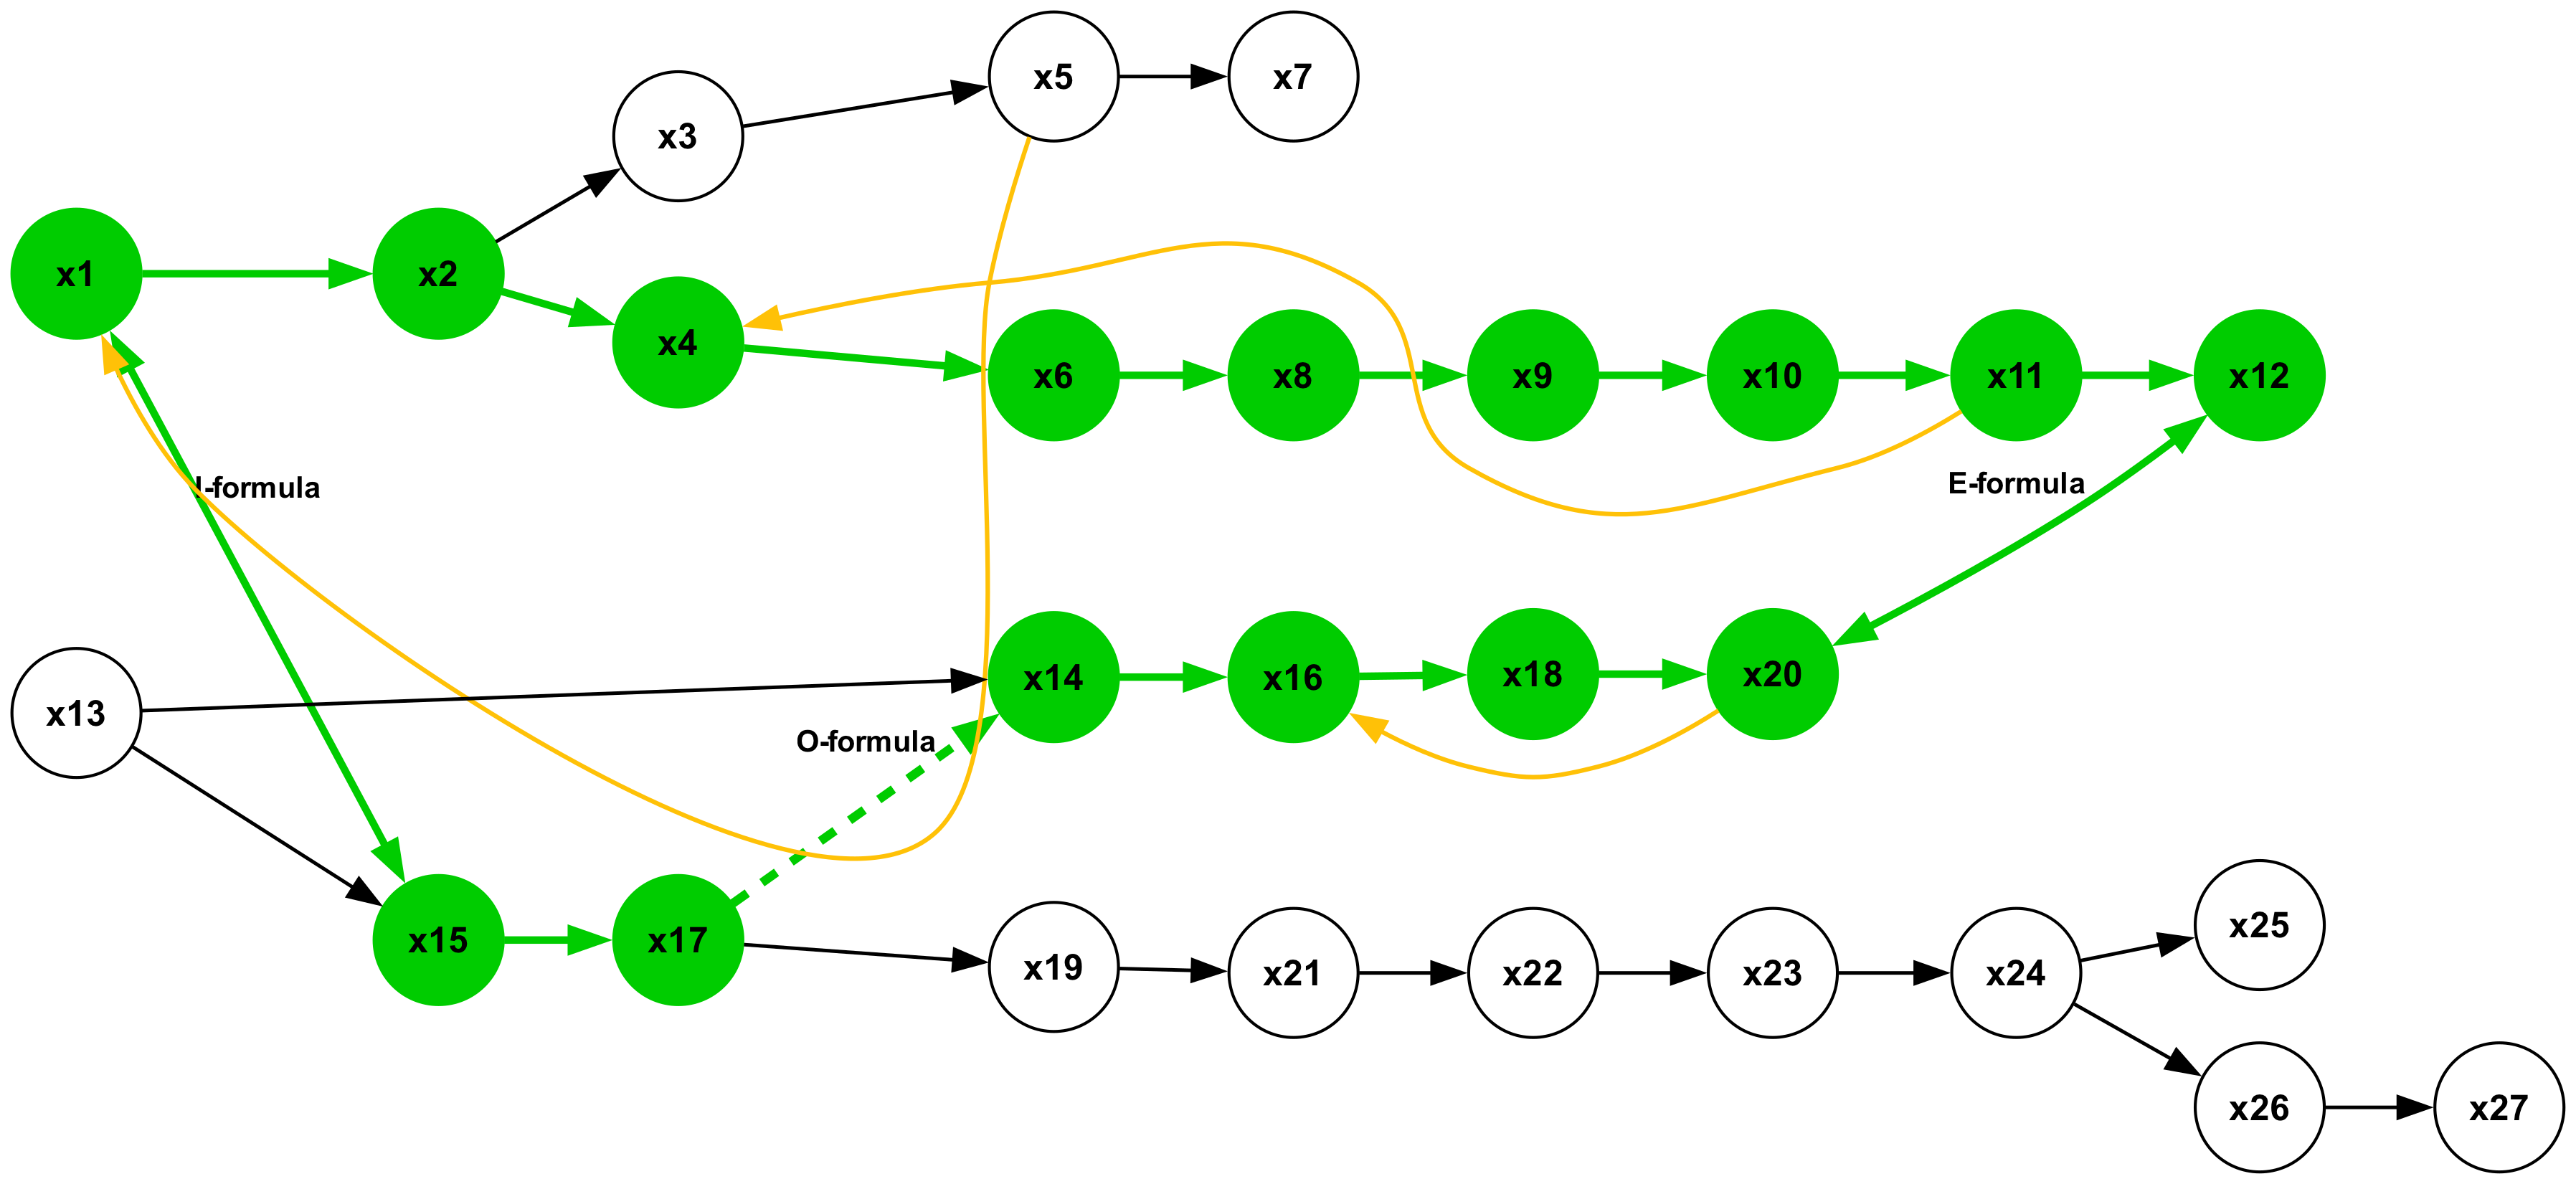
The image displays a directed graph (network diagram) consisting of 27 nodes labeled `x1` through `x27`. Nodes are connected by directed edges (arrows) of three types: solid black, solid green, and curved orange. Some edges are annotated with formula labels. The graph illustrates a complex system of state transitions, with distinct pathways, branching points, and feedback loops. The visual encoding (node color, edge color/style) appears to signify different types of states or transition rules.
### Components/Axes
**Nodes:**
* **Total Nodes:** 27, labeled sequentially from `x1` to `x27`.
* **Node Types (by color):**
* **Green Nodes (15 total):** `x1`, `x2`, `x4`, `x6`, `x8`, `x9`, `x10`, `x11`, `x12`, `x14`, `x15`, `x16`, `x17`, `x18`, `x20`.
* **White Nodes (12 total):** `x3`, `x5`, `x7`, `x13`, `x19`, `x21`, `x22`, `x23`, `x24`, `x25`, `x26`, `x27`.
**Edges (Transitions):**
* **Solid Black Arrows:** Represent standard or primary transitions.
* **Solid Green Arrows:** Represent a specific class of transitions, some of which are labeled.
* **Curved Orange Arrows:** Represent feedback or secondary transitions, looping back to earlier nodes.
* **Dashed Green Arrow:** A single instance, labeled "O-formula".
**Labeled Formulas:**
1. **"I-formula":** Associated with the **green arrow** from node `x1` to node `x15`.
2. **"E-formula":** Associated with the **green arrow** from node `x20` to node `x12`.
3. **"O-formula":** Associated with the **dashed green arrow** from node `x17` to node `x14`.
### Detailed Analysis
**Spatial Layout & Pathways:**
The graph flows generally from left to right, with two primary entry points on the left (`x1` and `x13`).
**1. Upper Pathway (Starting from `x1`):**
* `x1` (green) → `x2` (green) [green arrow].
* From `x2`, the path splits:
* `x2` → `x3` (white) → `x5` (white) → `x7` (white) [black arrows].
* `x2` → `x4` (green) → `x6` (green) → `x8` (green) → `x9` (green) → `x10` (green) → `x11` (green) → `x12` (green) [green arrows].
* **Feedback Loops (Orange):**
* `x5` (white) → `x4` (green).
* `x9` (green) → `x8` (green).
**2. Lower Pathway (Starting from `x13`):**
* `x13` (white) splits into two green-arrow transitions:
* `x13` → `x14` (green).
* `x13` → `x15` (green).
* From `x15`:
* `x15` → `x17` (green) [green arrow].
* `x17` → `x19` (white) → `x21` (white) → `x22` (white) → `x23` (white) → `x24` (white) → `x25` (white) and `x26` (white) → `x27` (white) [black arrows].
* From `x14`:
* `x14` → `x16` (green) → `x18` (green) → `x20` (green) [green arrows].
* `x20` → `x12` (green) [green arrow, labeled "E-formula"].
* **Feedback Loop (Orange):** `x20` (green) → `x18` (green).
**3. Cross-Connections & Special Transitions:**
* **"I-formula":** A direct green-arrow transition from `x1` to `x15`, connecting the upper and lower pathways at their origins.
* **"O-formula":** A dashed green-arrow transition from `x17` to `x14`, creating a link from the lower pathway's branch (`x15`→`x17`) back to the start of the `x14`→`x16`→`x18`→`x20` chain.
* **Additional Orange Feedback:** An orange arrow also connects `x1` to `x15`, running parallel to the green "I-formula" arrow.
### Key Observations
1. **Node Color Segregation:** Green nodes form the core of the interconnected pathways, while white nodes are primarily at the periphery (start/end points like `x3`, `x5`, `x7`, `x13`, `x19`, `x21`-`x27`) or within a specific branch (`x3`, `x5`, `x7`).
2. **Convergence Point:** Node `x12` is a major convergence point, receiving inputs from the long upper chain (`x11`) and the lower pathway chain (`x20`).
3. **Feedback Mechanisms:** The system contains four distinct feedback loops (orange arrows), suggesting iterative processes or state corrections: `x5`→`x4`, `x9`→`x8`, `x20`→`x18`, and `x1`→`x15`.
4. **Formulaic Transitions:** Three transitions are explicitly governed by named formulas ("I", "E", "O"), indicating they follow specific, possibly mathematical or logical, rules distinct from the standard transitions.
5. **Dashed Line Significance:** The "O-formula" transition is uniquely represented by a dashed line, which may denote a conditional, optional, or probabilistic transition.
### Interpretation
This diagram models a **state machine or process flow** with complex interdependencies. The green nodes likely represent **active, processed, or "in-system" states**, while white nodes represent **initial, terminal, or external states**.
* **System Function:** The graph depicts a system where processes can follow multiple parallel paths (`x1`-branch and `x13`-branch), interact via cross-connections (`I-formula`, `O-formula`), and converge at a common endpoint (`x12`). The feedback loops imply that the system is **non-linear and self-correcting**; later stages can influence earlier ones, allowing for refinement or iteration.
* **Role of Formulas:** The labeled formulas ("I", "E", "O") mark **critical control points**. "I-formula" (`x1`→`x15`) may represent an **Initialization** or **Input** rule that seeds the lower pathway. "E-formula" (`x20`→`x12`) could be an **Exit** or **Evaluation** rule that finalizes a process. "O-formula" (`x17`→`x14`) might be an **Optional** or **Override** rule that redirects flow.
* **Anomaly/Notable Feature:** The dual connection from `x1` to `x15` (one green "I-formula", one orange feedback) is striking. This could indicate that the same state transition is triggered by two different mechanisms: a primary rule (green) and a feedback-driven correction (orange).
* **Overall Purpose:** The diagram is likely used in fields like **control theory, computer science (algorithm design), or systems engineering** to visualize the flow of data, control, or state changes in a complex, iterative system. It emphasizes connectivity, conditional pathways, and the importance of specific transformation rules.