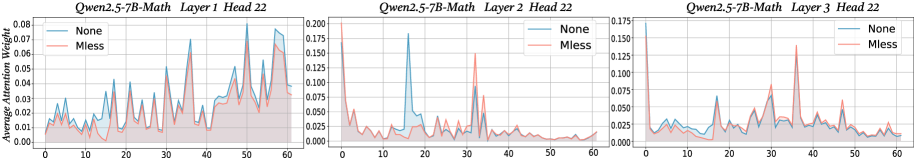
## Line Chart: Attention Weight Comparison
### Overview
The image presents three line charts, each comparing the "Average Attention Weight" of two conditions ("None" and "Miess") across 60 steps. Each chart corresponds to a different layer of a model named "Qwen2.5-7B-Math", specifically Layer 1 Head 22, Layer 2 Head 22, and Layer 3 Head 22. The charts visually represent how attention weight changes over these steps for both conditions.
### Components/Axes
* **X-axis:** Represents the step number, ranging from 0 to 60.
* **Y-axis:** Represents the "Average Attention Weight", with scales varying for each chart:
* Chart 1 (Layer 1): 0 to 0.08
* Chart 2 (Layer 2): 0 to 0.20
* Chart 3 (Layer 3): 0 to 0.135
* **Legend:** Located in the top-right corner of each chart, distinguishing between two lines:
* "None" (Blue line)
* "Miess" (Red line)
* **Title:** Each chart is titled with the model name and layer information: "Qwen2.5-7B-Math Layer [Number] Head 22".
### Detailed Analysis or Content Details
**Chart 1: Qwen2.5-7B-Math Layer 1 Head 22**
* **"None" (Blue Line):** The line fluctuates significantly between approximately 0.01 and 0.07. It starts around 0.02 at step 0, rises to a peak of approximately 0.07 around step 10, then dips to around 0.01 at step 20, and continues fluctuating.
* **"Miess" (Red Line):** This line also fluctuates, generally staying between 0.01 and 0.06. It begins around 0.03 at step 0, rises to a peak of approximately 0.06 around step 10, then dips to around 0.01 at step 20, and continues fluctuating.
* The lines are generally close in value, with "Miess" often slightly higher than "None" in the first half of the chart.
**Chart 2: Qwen2.5-7B-Math Layer 2 Head 22**
* **"None" (Blue Line):** This line exhibits a more pronounced peak around step 20, reaching approximately 0.15. It generally stays between 0.01 and 0.15, with a relatively stable baseline around 0.02-0.03.
* **"Miess" (Red Line):** This line shows a very sharp peak around step 20, reaching approximately 0.18. It fluctuates between 0.00 and 0.18, with a baseline around 0.02.
* The "Miess" line is significantly higher than the "None" line around step 20.
**Chart 3: Qwen2.5-7B-Math Layer 3 Head 22**
* **"None" (Blue Line):** This line fluctuates between approximately 0.01 and 0.09. It starts around 0.03 at step 0, rises to a peak of approximately 0.09 around step 10, then dips to around 0.02 at step 20, and continues fluctuating.
* **"Miess" (Red Line):** This line fluctuates between approximately 0.01 and 0.07. It starts around 0.02 at step 0, rises to a peak of approximately 0.07 around step 10, then dips to around 0.02 at step 20, and continues fluctuating.
* The lines are generally close in value, with "None" often slightly higher than "Miess".
### Key Observations
* All three charts show fluctuating attention weights for both conditions.
* Layer 2 exhibits the most significant difference between the "None" and "Miess" conditions, with "Miess" showing a much higher attention weight around step 20.
* Layer 1 and Layer 3 show more similar behavior between the two conditions.
* The scales of the Y-axis vary between the charts, indicating different magnitudes of attention weight in each layer.
### Interpretation
The charts likely represent the impact of the "Miess" condition on the attention mechanism within the Qwen2.5-7B-Math model. The significant peak in attention weight for "Miess" in Layer 2 suggests that this layer is particularly sensitive to the "Miess" condition. This could indicate that the "Miess" condition triggers a specific pattern of attention that is more pronounced in Layer 2. The fluctuations in attention weight across all layers and conditions suggest a dynamic and complex attention process. The varying scales of the Y-axis imply that different layers contribute differently to the overall attention mechanism. The data suggests that the "Miess" condition alters the attention weights, particularly in Layer 2, potentially influencing the model's processing of information. Further investigation would be needed to understand the specific meaning of the "Miess" condition and its impact on the model's performance.