# Technical Data Extraction: Performance Metrics Analysis
This document contains a detailed extraction of data from three performance charts labeled (a), (b), and (c).
---
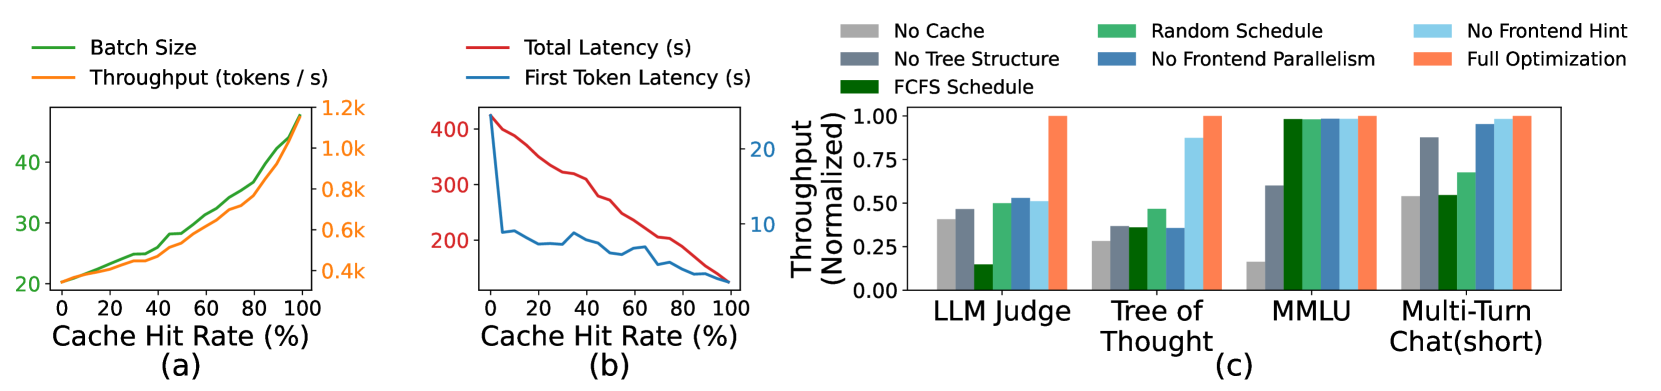
## Chart (a): Impact of Cache Hit Rate on Batch Size and Throughput
### Metadata
- **X-Axis:** Cache Hit Rate (%) [Range: 0 to 100]
- **Primary Y-Axis (Left, Green):** Batch Size [Range: 20 to 40+]
- **Secondary Y-Axis (Right, Orange):** Throughput (tokens / s) [Range: 0.4k to 1.2k]
- **Legend Location:** Top Left
### Data Series Trends
1. **Batch Size (Green Line):** Shows a consistent upward slope. The growth rate increases slightly as the cache hit rate exceeds 60%.
2. **Throughput (Orange Line):** Shows a consistent upward slope, closely tracking the batch size. It exhibits exponential-like growth towards the 100% hit rate mark.
### Key Data Points (Approximate)
| Cache Hit Rate (%) | Batch Size (Green) | Throughput (Orange) |
| :--- | :--- | :--- |
| 0 | 20 | ~0.4k |
| 20 | ~23 | ~0.45k |
| 40 | ~26 | ~0.5k |
| 60 | ~32 | ~0.65k |
| 80 | ~37 | ~0.85k |
| 100 | ~48 | ~1.15k |
---
## Chart (b): Impact of Cache Hit Rate on Latency
### Metadata
- **X-Axis:** Cache Hit Rate (%) [Range: 0 to 100]
- **Primary Y-Axis (Left, Red):** Total Latency (s) [Range: 200 to 400+]
- **Secondary Y-Axis (Right, Blue):** First Token Latency (s) [Range: 10 to 20+]
- **Legend Location:** Top Right
### Data Series Trends
1. **Total Latency (Red Line):** Shows a steady, linear downward trend as the cache hit rate increases, dropping from over 400s to approximately 120s.
2. **First Token Latency (Blue Line):** Shows a sharp initial drop between 0% and 10% hit rate, followed by a gradual, fluctuating decline toward the 100% mark.
### Key Data Points (Approximate)
| Cache Hit Rate (%) | Total Latency (Red) | First Token Latency (Blue) |
| :--- | :--- | :--- |
| 0 | ~430s | ~25s |
| 20 | ~350s | ~8s |
| 40 | ~310s | ~8s |
| 60 | ~230s | ~7s |
| 80 | ~180s | ~5s |
| 100 | ~120s | ~3s |
---
## Chart (c): Throughput Ablation Study across Workloads
### Metadata
- **Y-Axis:** Throughput (Normalized) [Range: 0.00 to 1.00]
- **X-Axis Categories:** LLM Judge, Tree of Thought, MMLU, Multi-Turn Chat (short)
- **Legend (Top):**
* **Light Gray:** No Cache
* **Dark Gray:** No Tree Structure
* **Dark Green:** FCFS Schedule
* **Medium Green:** Random Schedule
* **Dark Blue:** No Frontend Parallelism
* **Light Blue:** No Frontend Hint
* **Orange:** Full Optimization
### Data Table (Normalized Throughput)
| Configuration | LLM Judge | Tree of Thought | MMLU | Multi-Turn Chat |
| :--- | :---: | :---: | :---: | :---: |
| **No Cache** (Light Gray) | ~0.40 | ~0.28 | ~0.18 | ~0.53 |
| **No Tree Structure** (Dark Gray) | ~0.45 | ~0.35 | ~0.60 | ~0.88 |
| **FCFS Schedule** (Dark Green) | ~0.15 | ~0.35 | ~0.98 | ~0.53 |
| **Random Schedule** (Med Green) | ~0.50 | ~0.45 | ~0.98 | ~0.68 |
| **No Frontend Parallelism** (Dark Blue) | ~0.52 | ~0.35 | ~0.98 | ~0.95 |
| **No Frontend Hint** (Light Blue) | ~0.50 | ~0.88 | ~0.98 | ~0.98 |
| **Full Optimization** (Orange) | **1.00** | **1.00** | **1.00** | **1.00** |
### Key Observations
* **Full Optimization** consistently achieves the highest throughput (1.00) across all test cases.
* **Tree of Thought** is most sensitive to the "No Frontend Hint" and "No Cache" configurations.
* **MMLU** shows significant performance degradation specifically when "No Cache" is used, but remains high for most other configurations.
* **LLM Judge** shows the worst performance under the "FCFS Schedule" compared to other workloads.