## Funnel Chart: XAI Paper Validation
### Overview
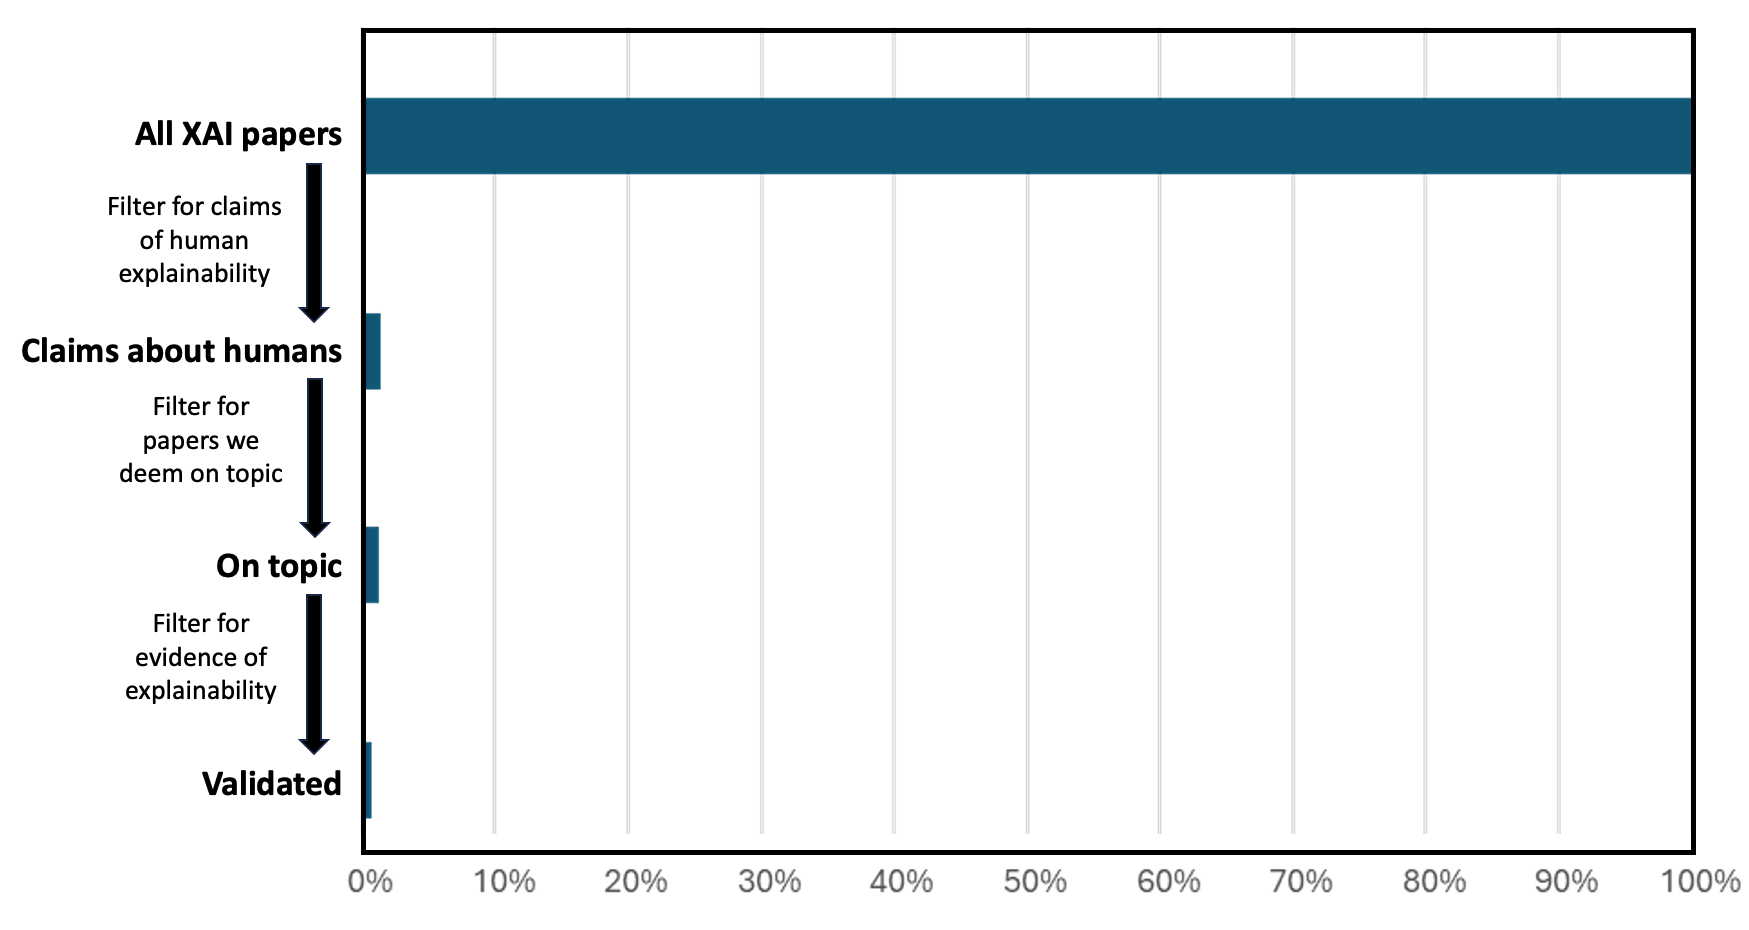
The image is a funnel chart illustrating the filtering process of XAI (Explainable AI) papers, starting from all XAI papers and narrowing down to validated papers based on specific criteria. The chart visually represents the reduction in the number of papers at each filtering stage.
### Components/Axes
* **Y-axis Labels (Top to Bottom):**
* All XAI papers
* Filter for claims of human explainability
* Claims about humans
* Filter for papers we deem on topic
* On topic
* Filter for evidence of explainability
* Validated
* **X-axis Scale:** 0% to 100%, with increments of 10%.
* **Data Series:** The chart displays a single data series represented by horizontal bars. The bars are colored in a dark teal.
* **Flow Direction:** Vertical, indicated by downward-pointing arrows between the stages.
### Detailed Analysis
The funnel chart shows the progressive reduction in the number of papers as they pass through each filter.
* **All XAI papers:** The initial bar extends to approximately 100% on the x-axis.
* **Claims about humans:** After filtering for claims about humans, the bar reduces to approximately 5%.
* **On topic:** After filtering for papers deemed on topic, the bar reduces to approximately 2%.
* **Validated:** After filtering for evidence of explainability, the bar reduces to approximately 1%.
### Key Observations
* There is a significant drop in the number of papers after each filtering stage, particularly between "All XAI papers" and "Claims about humans."
* The final "Validated" category represents a very small fraction of the initial "All XAI papers" category.
### Interpretation
The funnel chart demonstrates that only a small percentage of XAI papers meet the criteria of making claims about humans, being deemed on topic, and providing evidence of explainability. This suggests that many XAI papers may not directly address human-centered explainability or may lack sufficient evidence to support their claims. The large drop-off at the initial filter ("Claims about humans") indicates that a significant portion of XAI research does not explicitly focus on human explainability. The subsequent filters further narrow down the pool, highlighting the stringent requirements for validation in this context.