\n
## Diagram: XAI Paper Filtering Process
### Overview
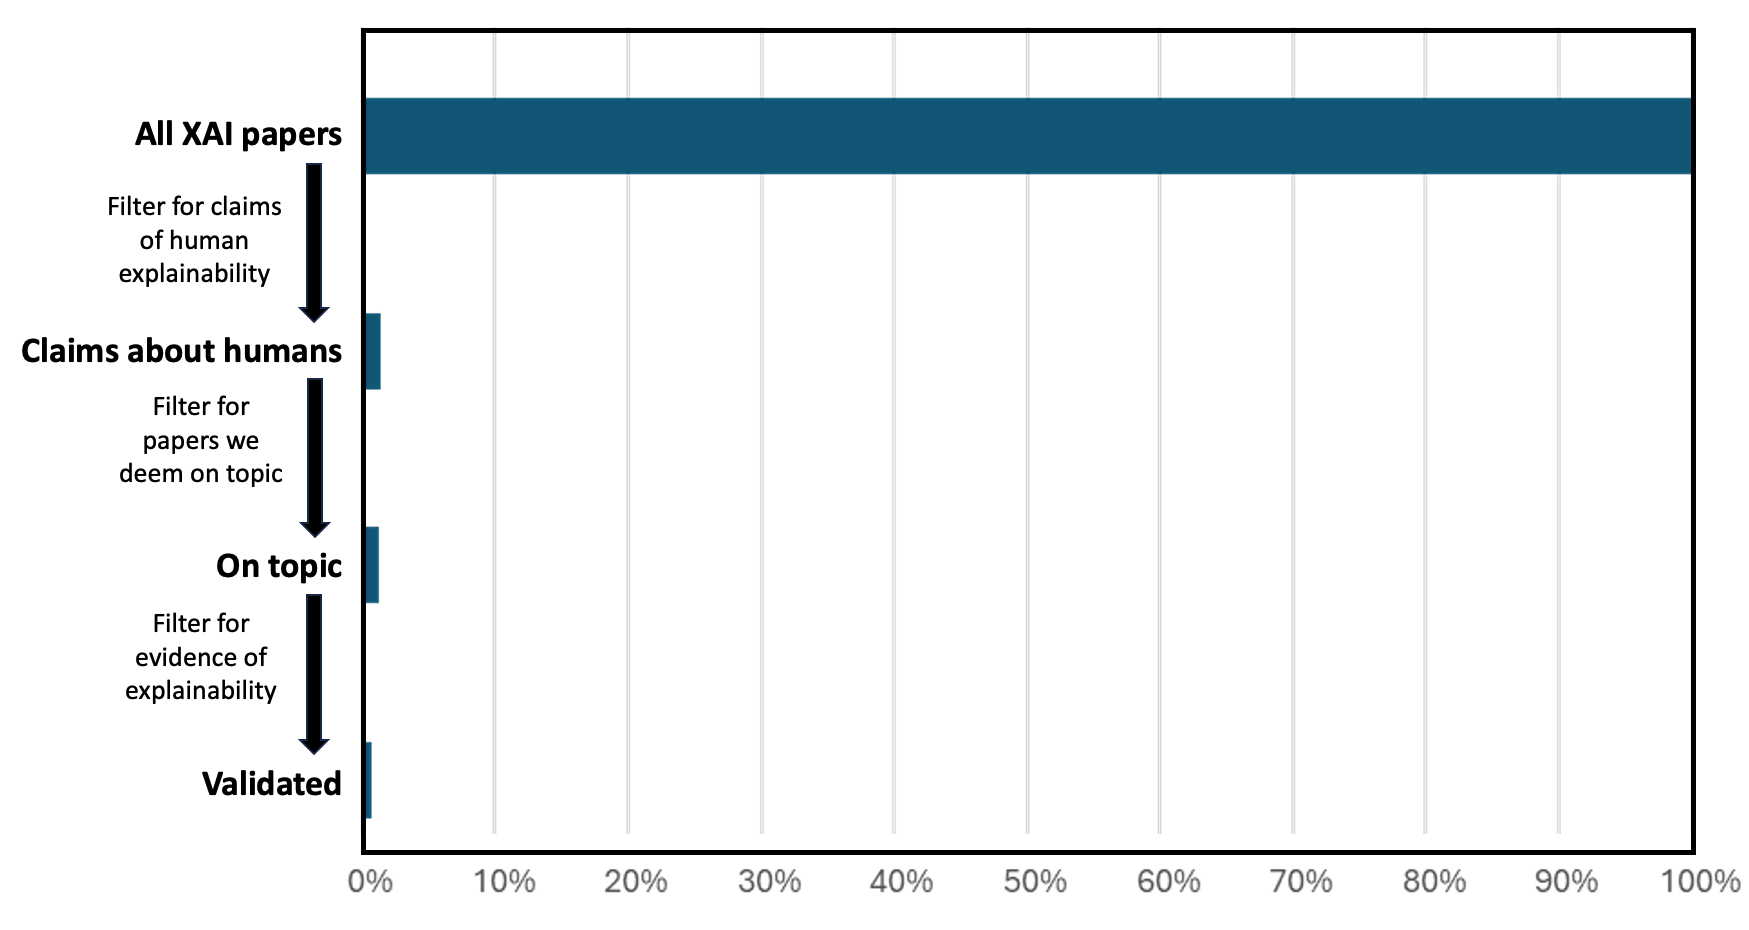
This diagram illustrates a funnel-like process for filtering XAI (Explainable Artificial Intelligence) papers, starting with all XAI papers and progressively narrowing down to a validated subset based on specific criteria. The diagram uses horizontal bars to represent the quantity of papers at each stage, with percentages indicating the proportion relative to the initial set.
### Components/Axes
* **Vertical Axis:** Represents the stages of the filtering process: "All XAI papers", "Claims about humans", "On topic", and "Validated".
* **Horizontal Axis:** Represents percentage, ranging from 0% to 100%, indicating the proportion of papers remaining after each filter.
* **Labels:**
* "All XAI papers"
* "Filter for claims of human explainability"
* "Claims about humans"
* "Filter for papers we deem on topic"
* "On topic"
* "Filter for evidence of explainability"
* "Validated"
* **Arrows:** Indicate the flow of the filtering process.
### Detailed Analysis
The diagram shows a progressive reduction in the number of papers as they move through the filtering stages.
* **All XAI papers:** The initial bar extends from 0% to approximately 92%, representing the total number of XAI papers considered.
* **Claims about humans:** After filtering for claims of human explainability, the bar extends from 0% to approximately 65%. This indicates that roughly 65% of the initial XAI papers contain claims related to human explainability.
* **On topic:** Following the filter for papers deemed on topic, the bar extends from 0% to approximately 35%. This suggests that about 35% of the papers with claims about humans are considered relevant to the specific research focus.
* **Validated:** The final filter for evidence of explainability results in a bar extending from 0% to approximately 10%. This means that only about 10% of the initial XAI papers are ultimately validated based on the defined criteria.
### Key Observations
* There is a significant reduction in the number of papers at each filtering stage.
* The largest drop occurs between "Claims about humans" and "On topic", suggesting that many papers claiming human explainability are not directly relevant to the research topic.
* The final stage, "Validated", represents a small fraction of the initial set of papers.
### Interpretation
This diagram illustrates a rigorous filtering process designed to identify a highly specific subset of XAI papers. The process emphasizes the importance of focusing on papers that not only claim human explainability but also provide concrete evidence and relevance to the research topic. The substantial reduction in papers at each stage suggests that the criteria are selective and aim to ensure the quality and focus of the final validated set. The diagram highlights the challenges of identifying relevant and well-supported research within the broader field of XAI. The funnel shape visually represents the increasing stringency of the criteria and the resulting concentration of high-quality papers.