# Technical Document Analysis: XAI Paper Filtering Process
## Chart Type
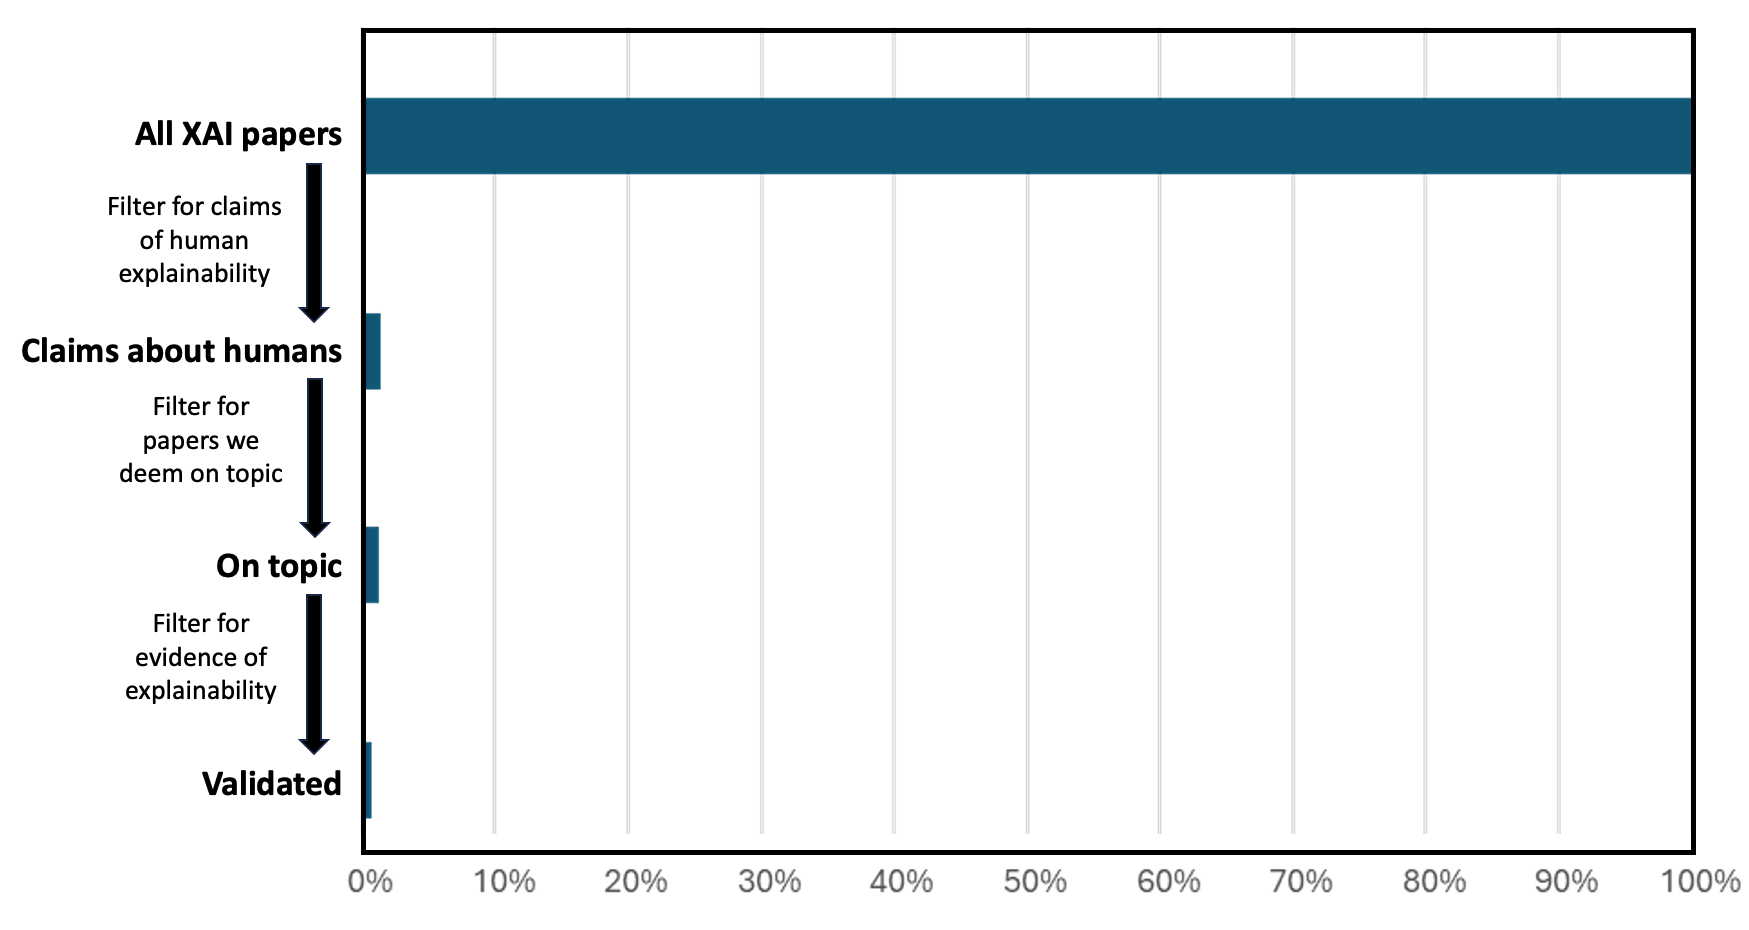
Horizontal bar chart with sequential filtering stages.
## Axes
- **X-axis**: Percentage scale (0% to 100%) with grid lines at 10% intervals.
- **Y-axis**: Categorical labels representing filtering stages (top to bottom):
1. All XAI papers
2. Claims about humans
3. On topic
4. Validated
## Key Components
1. **Bars**:
- All bars colored dark blue (#003f5c).
- Lengths proportional to remaining papers after each filter.
2. **Annotations**:
- Arrows connecting stages with explanatory text:
- "Filter for claims of human explainability" (between All XAI papers → Claims about humans)
- "Filter for papers we deem on topic" (between Claims about humans → On topic)
- "Filter for evidence of explainability" (between On topic → Validated)
## Data Points (Estimated Percentages)
| Stage | Estimated % | Notes |
|------------------------|-------------|--------------------------------|
| All XAI papers | 100% | Full dataset |
| Claims about humans | ~2-3% | Post-human explainability filter |
| On topic | ~1-2% | Post-topic relevance filter |
| Validated | ~0.5-1% | Post-evidence filter |
## Process Flow
1. **Initial Scope**: All XAI papers (100%) represent the total dataset.
2. **First Filter**: Papers claiming human explainability reduce the pool to ~2-3%.
3. **Second Filter**: Topic relevance further narrows to ~1-2%.
4. **Final Filter**: Evidence validation results in ~0.5-1% validated papers.
## Observations
- Each filter reduces the dataset by ~90%+.
- Final validated papers represent <1% of the original corpus.
- No legend present; single color used for all bars.
## Language
English only. No non-English text detected.
## Spatial Grounding
- Y-axis labels positioned left of bars.
- X-axis markers at bottom edge.
- Arrows connect stages vertically with explanatory text.
## Trend Verification
- Bars decrease monotonically from top to bottom (100% → ~1%).
- Visual confirmation matches expected filtering pattern.
## Component Isolation
1. **Header**: No explicit title present.
2. **Main Chart**: Horizontal bars with percentage scale.
3. **Footer**: No additional elements.
## Critical Notes
- Exact percentages not provided; estimates based on bar length relative to x-axis markers.
- No data table present; process described via sequential filtering stages.