## Line Chart: Logarithmic Function with Varying 'c' Values
### Overview
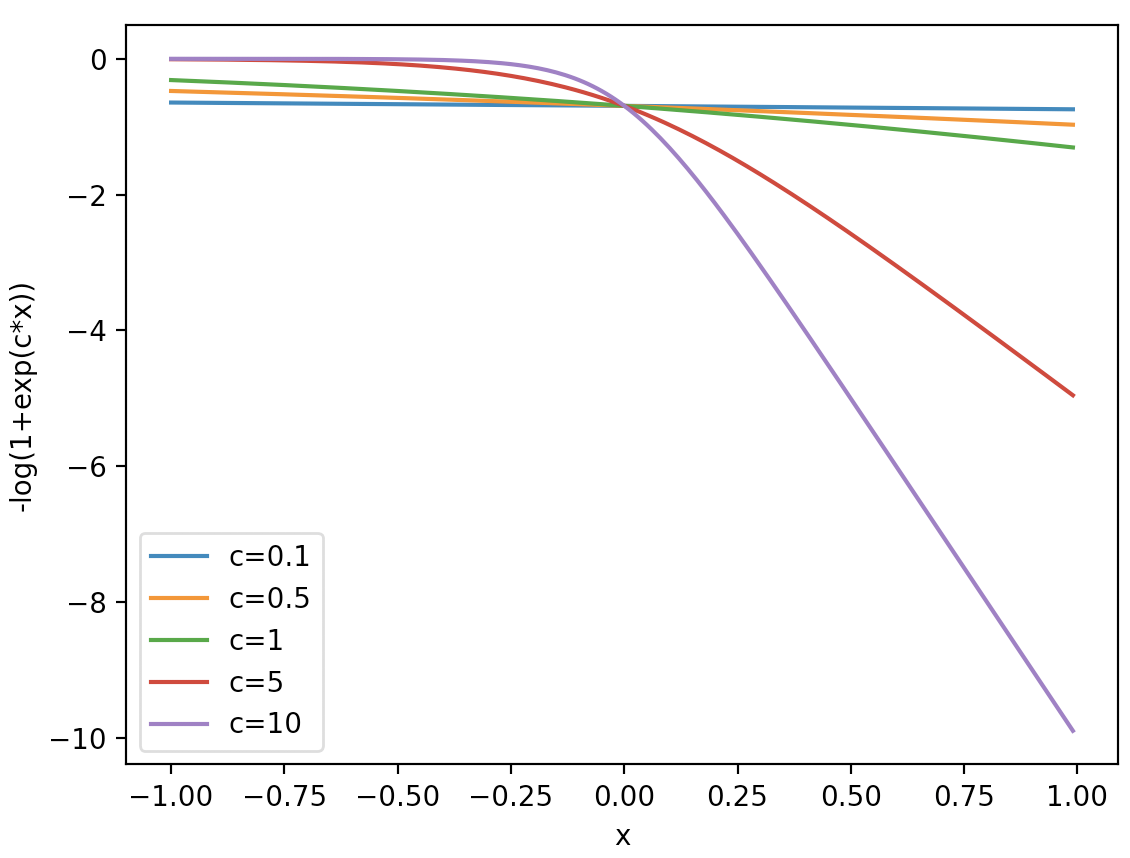
The image is a line chart displaying the relationship between 'x' and '-log(1 + exp(c*x))' for different values of 'c'. The chart includes five lines, each representing a different value of 'c' (0.1, 0.5, 1, 5, and 10). The x-axis ranges from -1 to 1, and the y-axis ranges from -10 to 0.
### Components/Axes
* **X-axis:** Labeled "x", ranges from -1.00 to 1.00 in increments of 0.25.
* **Y-axis:** Labeled "-log(1+exp(c\*x))", ranges from -10 to 0 in increments of 2.
* **Legend:** Located on the left side of the chart. It maps the color of each line to a specific value of 'c':
* Blue: c = 0.1
* Orange: c = 0.5
* Green: c = 1
* Red: c = 5
* Purple: c = 10
### Detailed Analysis
* **Blue Line (c=0.1):** This line is nearly flat, hovering around -0.7. It shows a slight downward slope as 'x' increases.
* At x = -1.00, y ≈ -0.7
* At x = 1.00, y ≈ -0.8
* **Orange Line (c=0.5):** This line also exhibits a gentle downward slope.
* At x = -1.00, y ≈ -0.7
* At x = 1.00, y ≈ -1.2
* **Green Line (c=1):** This line shows a more noticeable downward slope compared to the blue and orange lines.
* At x = -1.00, y ≈ -0.6
* At x = 1.00, y ≈ -1.7
* **Red Line (c=5):** This line has a significant downward slope, especially for positive values of 'x'.
* At x = -1.00, y ≈ -0.3
* At x = 1.00, y ≈ -5.0
* **Purple Line (c=10):** This line exhibits the steepest downward slope among all the lines.
* At x = -1.00, y ≈ 0
* At x = 1.00, y ≈ -10
### Key Observations
* As the value of 'c' increases, the downward slope of the line becomes steeper.
* For negative values of 'x', the lines are relatively close together, indicating that the value of 'c' has less impact on the function's output in this region.
* For positive values of 'x', the lines diverge significantly, demonstrating that the value of 'c' has a much greater impact on the function's output.
### Interpretation
The chart illustrates how the parameter 'c' affects the behavior of the function '-log(1 + exp(c*x))'. A larger 'c' results in a more rapid decrease in the function's value as 'x' increases, especially for positive 'x' values. This suggests that 'c' acts as a scaling factor for 'x' within the exponential function, amplifying its effect on the overall logarithmic result. The function appears to be more sensitive to changes in 'x' when 'c' is large.