\n
## Chart: Logarithmic Function Plots
### Overview
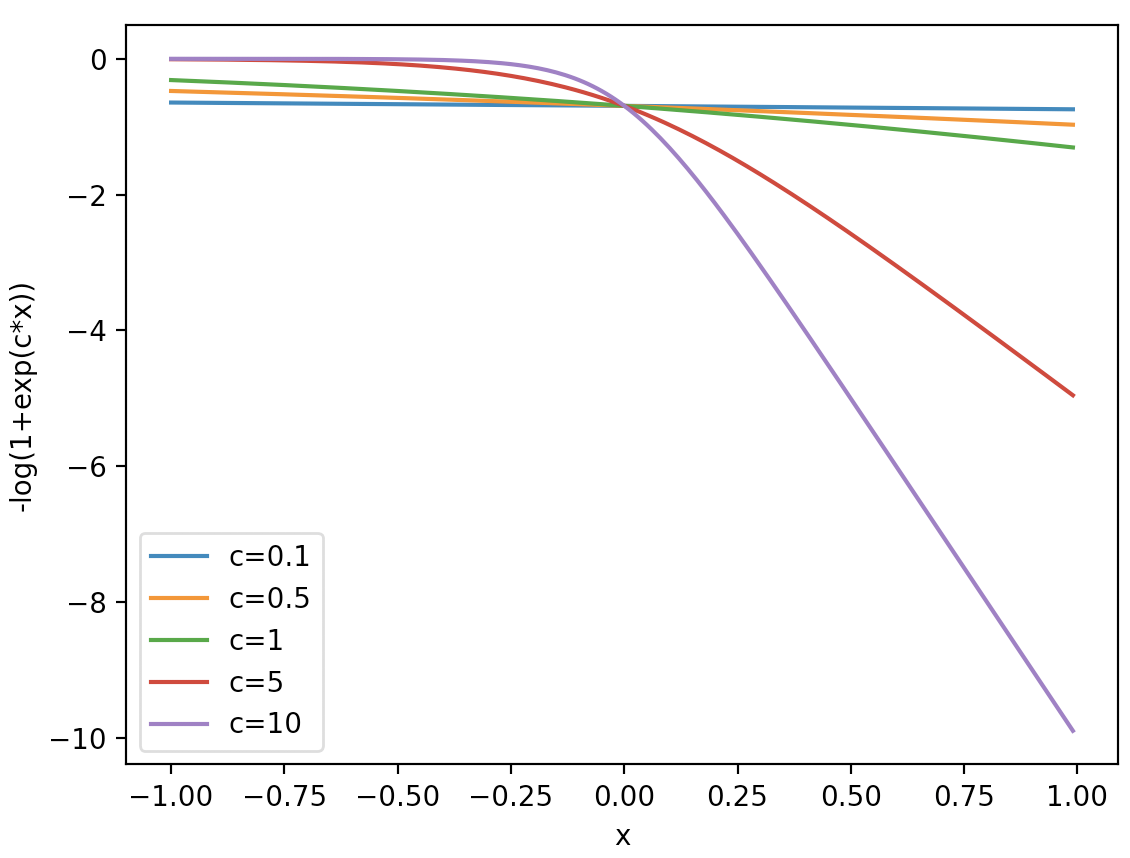
The image displays a line chart illustrating the behavior of the function `-log(1 + exp(c*x))` for different values of the parameter 'c'. The chart visualizes how the function's curve changes as 'c' increases, demonstrating a shift in the steepness and position of the curve.
### Components/Axes
* **X-axis:** Labeled "x", ranging from approximately -1.0 to 1.0 with increments of 0.25.
* **Y-axis:** Labeled "-log(1+exp(c*x))", ranging from approximately -10.0 to 0.0 with increments of 2.0.
* **Legend:** Located in the top-left corner, listing the following lines and their corresponding 'c' values:
* c=0.1 (Blue)
* c=0.5 (Orange)
* c=1 (Green)
* c=5 (Red)
* c=10 (Purple)
### Detailed Analysis
The chart contains five distinct lines, each representing a different value of 'c'.
* **c=0.1 (Blue):** The line is relatively flat, remaining close to 0 across the entire x-axis range. It starts at approximately 0.0 at x=-1.0 and ends at approximately 0.1 at x=1.0.
* **c=0.5 (Orange):** This line is also relatively flat, but shows a slight downward trend as x increases. It starts at approximately 0.0 at x=-1.0 and ends at approximately -0.3 at x=1.0.
* **c=1 (Green):** This line exhibits a more noticeable downward trend than the previous two. It starts at approximately 0.0 at x=-1.0 and ends at approximately -1.0 at x=1.0.
* **c=5 (Red):** This line shows a significant downward trend, becoming steeper as x increases. It starts at approximately 0.0 at x=-1.0 and ends at approximately -5.0 at x=1.0.
* **c=10 (Purple):** This line is the steepest, exhibiting a very rapid downward trend. It starts at approximately 0.0 at x=-1.0 and ends at approximately -10.0 at x=1.0. The curve transitions sharply around x=0.
### Key Observations
* As the value of 'c' increases, the slope of the line becomes steeper.
* All lines start at approximately y=0 when x=-1.
* The lines converge towards y=0 as x approaches -1.
* The lines diverge as x increases, with larger 'c' values resulting in more negative y-values.
* The transition from a relatively flat line to a steep slope occurs around x=0, and the transition point shifts slightly to the left as 'c' increases.
### Interpretation
The chart demonstrates the effect of the parameter 'c' on the function `-log(1 + exp(c*x))`. The function represents a sigmoid-like curve, and 'c' controls the steepness of the transition between the two asymptotic regions. A larger 'c' value results in a sharper transition, effectively making the function more sensitive to changes in 'x'. This type of function is commonly used in machine learning, particularly in logistic regression and neural networks, to model probabilities or activation functions. The steepness controlled by 'c' determines how quickly the function transitions between 0 and 1 (or in this case, 0 and negative infinity). The chart visually confirms that increasing 'c' leads to a more abrupt change in the function's output. The function is essentially a scaled and shifted logistic function.