## Bar Chart: Normalized Area Comparison Across Algorithms (Q4 vs Q8)
### Overview
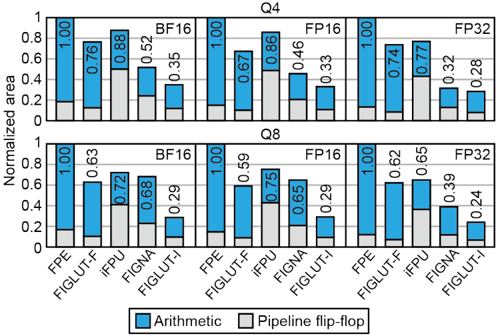
The image is a grouped bar chart comparing the normalized area of two algorithm types—**Arithmetic** (blue) and **Pipeline flip-flop** (gray)—across two sections labeled **Q4** and **Q8**. Each section contains six algorithms: **FPE**, **FIGLUT-F**, **iFPU**, **FIGNA**, **FIGLUT-I**, and **FP16/FP32** (grouped as separate categories). The y-axis represents normalized area (0–1), and the x-axis lists algorithms with their respective values.
---
### Components/Axes
- **X-Axis (Categories)**:
- **Q4 Section**: FPE, FIGLUT-F, iFPU, FIGNA, FIGLUT-I, FP16, FP32
- **Q8 Section**: FPE, FIGLUT-F, iFPU, FIGNA, FIGLUT-I, FP16, FP32
- **Y-Axis (Values)**: Normalized area (0–1, increments of 0.2).
- **Legend**:
- **Blue**: Arithmetic
- **Gray**: Pipeline flip-flop
- Positioned at the bottom center of the chart.
---
### Detailed Analysis
#### Q4 Section
1. **FPE**:
- Arithmetic: 1.00
- Pipeline flip-flop: 0.18
2. **FIGLUT-F**:
- Arithmetic: 0.76
- Pipeline flip-flop: 0.59
3. **iFPU**:
- Arithmetic: 0.88
- Pipeline flip-flop: 0.46
4. **FIGNA**:
- Arithmetic: 0.52
- Pipeline flip-flop: 0.33
5. **FIGLUT-I**:
- Arithmetic: 0.35
- Pipeline flip-flop: 0.28
6. **FP16**:
- Arithmetic: 1.00
- Pipeline flip-flop: 0.16
7. **FP32**:
- Arithmetic: 0.74
- Pipeline flip-flop: 0.32
#### Q8 Section
1. **FPE**:
- Arithmetic: 1.00
- Pipeline flip-flop: 0.18
2. **FIGLUT-F**:
- Arithmetic: 0.63
- Pipeline flip-flop: 0.59
3. **iFPU**:
- Arithmetic: 0.72
- Pipeline flip-flop: 0.75
4. **FIGNA**:
- Arithmetic: 0.68
- Pipeline flip-flop: 0.29
5. **FIGLUT-I**:
- Arithmetic: 0.29
- Pipeline flip-flop: 0.24
6. **FP16**:
- Arithmetic: 1.00
- Pipeline flip-flop: 0.16
7. **FP32**:
- Arithmetic: 0.62
- Pipeline flip-flop: 0.39
---
### Key Observations
1. **Arithmetic Dominance**:
- Arithmetic values consistently exceed Pipeline flip-flop values in both Q4 and Q8 (e.g., FPE in Q4: 1.00 vs. 0.18).
- Exceptions: iFPU in Q8 (Arithmetic: 0.72 vs. Pipeline: 0.75) and FIGLUT-F in Q8 (Arithmetic: 0.63 vs. Pipeline: 0.59).
2. **Q4 vs. Q8 Trends**:
- **Q4** shows higher Arithmetic values overall (e.g., FP32: 0.74 vs. Q8: 0.62).
- **Q8** has more balanced values between the two algorithm types (e.g., iFPU: 0.72 vs. 0.75).
3. **FP16 Consistency**:
- FP16 maintains the highest Arithmetic value (1.00) in both sections, with identical Pipeline flip-flop values (0.16).
4. **Pipeline Flip-flop Variability**:
- Values range from 0.16 (FP16) to 0.75 (iFPU in Q8), indicating significant variability across algorithms.
---
### Interpretation
- **Resource Allocation**: Arithmetic operations generally require more normalized area than Pipeline flip-flops, suggesting higher computational complexity or resource intensity.
- **Algorithm-Specific Insights**:
- **FPE** and **FP16** are the most area-intensive for Arithmetic, possibly due to their role in foundational computations.
- **iFPU** in Q8 is an outlier where Pipeline flip-flops slightly exceed Arithmetic, hinting at architectural optimizations in Q8.
- **Q4 vs. Q8 Differences**:
- Q4’s higher Arithmetic values may reflect a focus on precision or legacy configurations, while Q8’s balanced values suggest optimizations for efficiency.
- **FP32 Trends**:
- FP32 shows a notable drop in Arithmetic from Q4 (0.74) to Q8 (0.62), aligning with potential reductions in floating-point precision demands.
This data underscores the trade-offs between algorithmic complexity and resource utilization, with implications for hardware design and optimization strategies.