## Dual Distribution Charts: Jailbreakbench vs. Malicious Instruct
### Overview
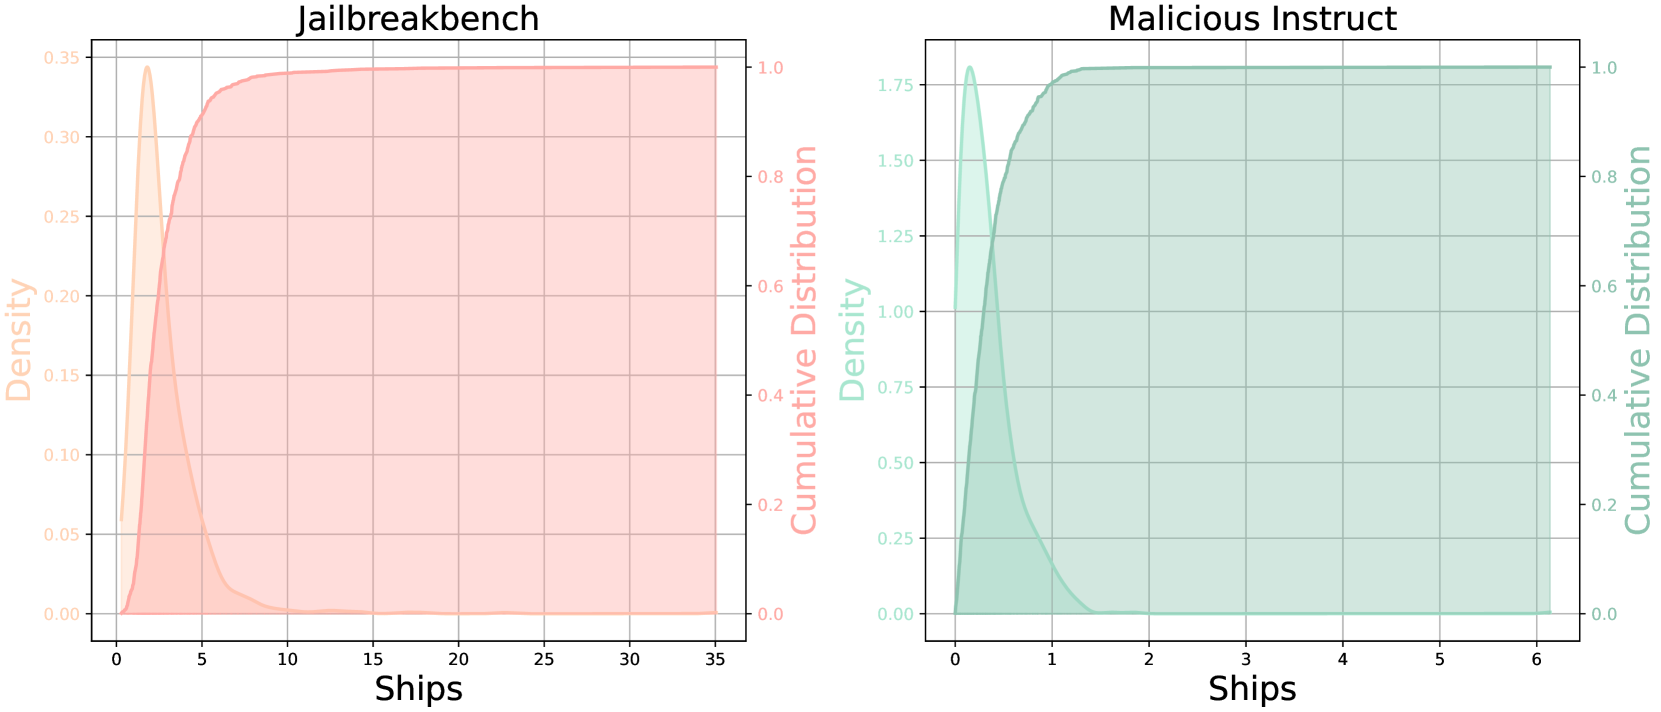
The image contains two side-by-side distribution charts comparing "Jailbreakbench" (left) and "Malicious Instruct" (right). Both plots show density curves and cumulative distribution functions (CDFs) for a variable labeled "Ships." The charts use distinct color schemes for density (shaded area) and CDF (line plot).
---
### Components/Axes
#### Jailbreakbench (Left Plot)
- **X-axis**: "Ships" (0–35, linear scale)
- **Y-axis (Left)**: "Density" (orange, 0–0.35)
- **Y-axis (Right)**: "Cumulative Distribution" (red, 0–1.0)
- **Legend**:
- Orange: Density curve
- Red: Cumulative distribution line
- **Key Features**:
- Density curve peaks sharply at ~2 ships, then declines rapidly.
- Cumulative distribution rises steeply to 1.0 by ~5 ships, then plateaus.
#### Malicious Instruct (Right Plot)
- **X-axis**: "Ships" (0–6, linear scale)
- **Y-axis (Left)**: "Density" (teal, 0–1.75)
- **Y-axis (Right)**: "Cumulative Distribution" (green, 0–1.0)
- **Legend**:
- Teal: Density curve
- Green: Cumulative distribution line
- **Key Features**:
- Density curve peaks at ~0.75 density for 0 ships, then declines steeply.
- Cumulative distribution jumps to 1.0 by ~1 ship, then remains flat.
---
### Detailed Analysis
#### Jailbreakbench
- **Density Curve**:
- Peaks at ~2 ships with a density of ~0.3.
- Rapid decline to near-zero density by ~10 ships.
- Uncertainty: Peak density likely between 1.5–2.5 ships.
- **Cumulative Distribution**:
- Reaches 1.0 by ~5 ships (uncertainty: 4.5–5.5 ships).
- Flatline after 5 ships indicates all data concentrated below this threshold.
#### Malicious Instruct
- **Density Curve**:
- Peaks at 0 ships with density ~0.75.
- Sharp decline to near-zero density by ~1 ship.
- Uncertainty: Peak density likely between 0.5–1.0 ships.
- **Cumulative Distribution**:
- Reaches 1.0 by ~1 ship (uncertainty: 0.5–1.5 ships).
- Flatline after 1 ship indicates extreme concentration at 0 ships.
---
### Key Observations
1. **Jailbreakbench**:
- Bimodal-like distribution with a sharp peak at 2 ships.
- Cumulative distribution suggests 95%+ of data lies below 5 ships.
2. **Malicious Instruct**:
- Extreme concentration at 0 ships (75% density).
- Cumulative distribution indicates 100% of data lies below 1 ship.
3. **Contrast**:
- Jailbreakbench shows broader variability (up to 35 ships).
- Malicious Instruct exhibits near-perfect clustering at 0 ships.
---
### Interpretation
The charts reveal fundamentally different distributions:
- **Jailbreakbench** demonstrates a typical distribution with a clear mode (2 ships) and gradual tail-off, suggesting moderate variability in ship counts.
- **Malicious Instruct** exhibits near-perfect clustering at 0 ships, implying a binary outcome (e.g., 0 vs. 1 ship) with no meaningful variation beyond this point.
The stark contrast in cumulative distributions highlights differing risk profiles: Jailbreakbench allows for gradual escalation, while Malicious Instruct suggests an immediate threshold effect. This could reflect differing operational constraints or failure modes in the systems being measured.