# Technical Document Extraction: Scatter Plot Analysis
## **Chart Overview**
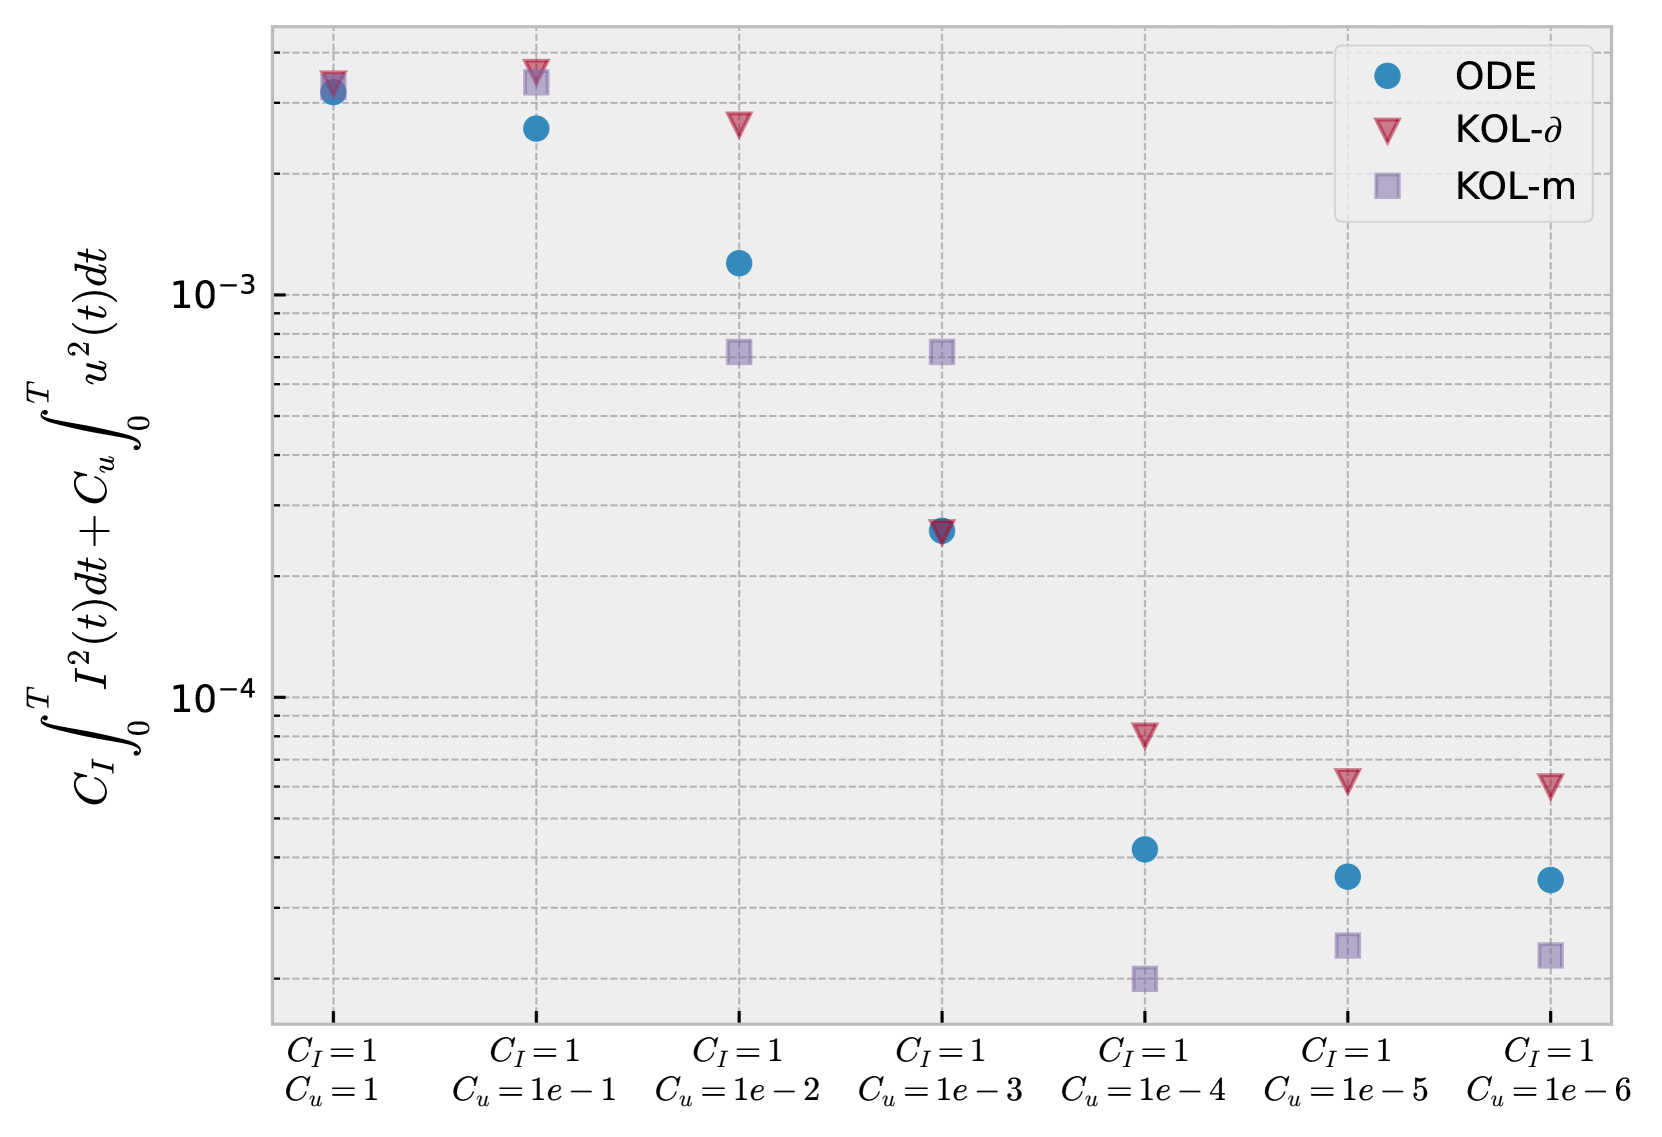
- **Type**: Scatter plot with log-scaled y-axis.
- **Purpose**: Comparison of three methods (ODE, KOL-δ, KOL-m) across varying parameters \( C_I \) and \( C_u \).
---
## **Axis Labels and Markers**
### **Y-Axis**
- **Title**:
\[
C_I \int_0^T I^2(t)dt + C_u \int_0^T u^2(t)dt
\]
- **Scale**: Logarithmic (base 10), ranging from \( 10^{-3} \) to \( 10^{-6} \).
- **Tick Labels**: \( 10^{-3}, 10^{-4}, 10^{-5}, 10^{-6} \).
### **X-Axis**
- **Categories**: Combinations of \( C_I \) and \( C_u \) values:
- \( C_I = 1 \), \( C_u = 1 \)
- \( C_I = 1 \), \( C_u = 1e^{-1} \)
- \( C_I = 1 \), \( C_u = 1e^{-2} \)
- \( C_I = 1 \), \( C_u = 1e^{-3} \)
- \( C_I = 1 \), \( C_u = 1e^{-4} \)
- \( C_I = 1 \), \( C_u = 1e^{-5} \)
- \( C_I = 1 \), \( C_u = 1e^{-6} \)
---
## **Legend**
- **Entries**:
- **ODE**: Blue circles (\( \circ \)).
- **KOL-δ**: Red triangles (\( \triangle \)).
- **KOL-m**: Purple squares (\( \square \)).
---
## **Data Points and Trends**
1. **ODE (Blue Circles)**:
- Highest values across all \( C_u \) levels for a given \( C_I \).
- Example: At \( C_I = 1 \), \( C_u = 1 \), value ≈ \( 10^{-3} \).
- Decreases monotonically as \( C_u \) decreases.
2. **KOL-δ (Red Triangles)**:
- Slightly higher than ODE at \( C_u = 1 \), \( C_u = 1e^{-1} \), and \( C_u = 1e^{-2} \).
- Converges with ODE at lower \( C_u \) values (e.g., \( C_u = 1e^{-3} \)).
3. **KOL-m (Purple Squares)**:
- Consistently the lowest values across all \( C_u \).
- Example: At \( C_I = 1 \), \( C_u = 1e^{-6} \), value ≈ \( 10^{-6} \).
---
## **Key Observations**
- **Method Performance**:
- KOL-m outperforms ODE and KOL-δ in minimizing the integral \( C_I \int_0^T I^2(t)dt + C_u \int_0^T u^2(t)dt \).
- ODE and KOL-δ show similar trends, with KOL-δ marginally better at higher \( C_u \).
- **Parameter Sensitivity**:
- All methods exhibit reduced performance (higher integral values) as \( C_u \) decreases, indicating sensitivity to \( C_u \).
---
## **Cross-Reference Validation**
- **Legend Colors vs. Markers**:
- Blue circles (ODE) match all blue data points.
- Red triangles (KOL-δ) align with red markers.
- Purple squares (KOL-m) correspond to purple markers.
- **Axis Consistency**: All \( C_I = 1 \) labels are correctly paired with their respective \( C_u \) values.
---
## **Conclusion**
The plot demonstrates that KOL-m achieves the lowest integral values across all tested \( C_u \) levels, suggesting superior performance in the evaluated metric. ODE and KOL-δ show comparable results, with KOL-δ slightly outperforming ODE at higher \( C_u \) values.