TECHNICAL ASSET FINGERPRINT
f5b2f7875042a470e257851b
Click to view fullscreen
Press ESC or click to close
FOUND IN PAPERS
EXPERT: gemini-2.0-flash VERSION 1
RUNTIME: nugit/gemini/gemini-2.0-flash
INTEL_VERIFIED
## Step-wise Loss Chart: Real vs. Predicted
### Overview
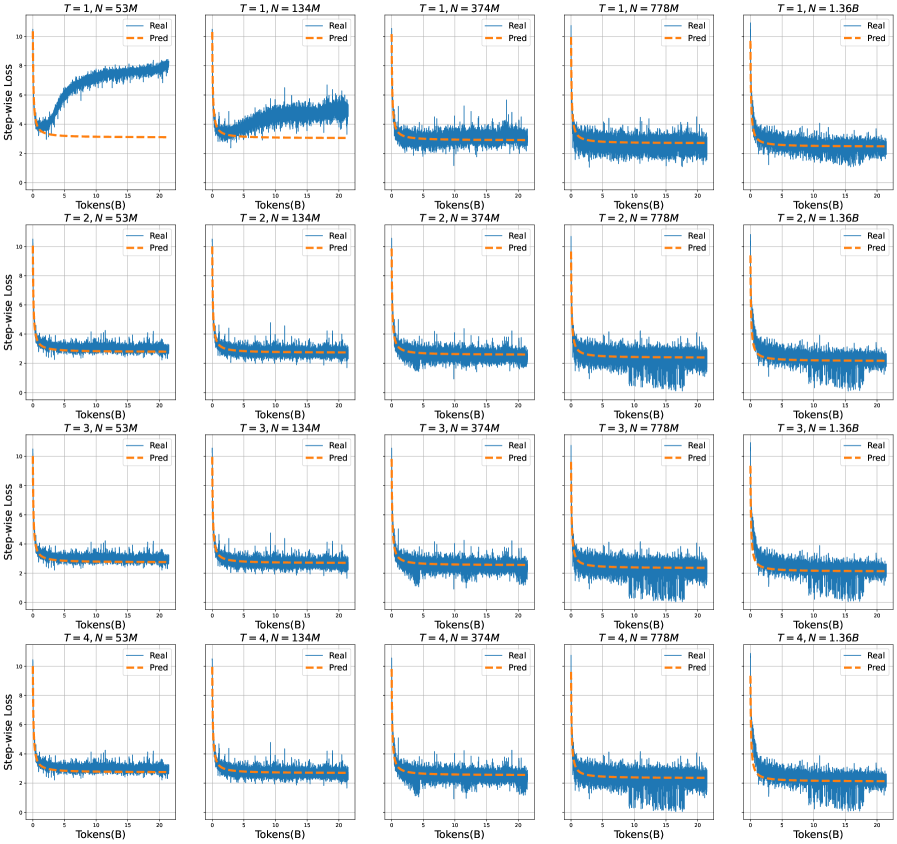
The image presents a grid of 20 line charts, arranged in a 4x5 matrix. Each chart displays the "Step-wise Loss" as a function of "Tokens(B)". The charts compare "Real" (actual) loss values against "Pred" (predicted) loss values. The charts are organized by two parameters: 'T' (rows, ranging from 1 to 4) and 'N' (columns, ranging from 53M to 1.36B).
### Components/Axes
* **Y-axis (Step-wise Loss):** Ranges from 0 to 10.
* **X-axis (Tokens(B)):** Ranges from 0 to 20.
* **Chart Titles:** Each chart has a title in the format "T = [value], N = [value]", where T ranges from 1 to 4 and N takes values 53M, 134M, 374M, 778M, and 1.36B.
* **Legend:** Each chart includes a legend in the top-right corner, indicating "Real" (blue line) and "Pred" (orange dashed line).
### Detailed Analysis
**Row 1: T = 1**
* **N = 53M:** The "Real" loss starts around 4, increases to approximately 8 around Tokens(B) = 5, and then stabilizes around 8. The "Pred" loss is relatively constant at approximately 3.
* **N = 134M:** The "Real" loss starts high (around 10) and decreases to approximately 2. The "Pred" loss starts high (around 10) and decreases to approximately 2, closely following the "Real" loss.
* **N = 374M:** The "Real" loss starts high (around 4) and decreases to approximately 1. The "Pred" loss starts high (around 4) and decreases to approximately 1, closely following the "Real" loss.
* **N = 778M:** The "Real" loss starts high (around 4) and decreases to approximately 1. The "Pred" loss starts high (around 4) and decreases to approximately 1, closely following the "Real" loss.
* **N = 1.36B:** The "Real" loss starts high (around 4) and decreases to approximately 1. The "Pred" loss starts high (around 4) and decreases to approximately 1, closely following the "Real" loss.
**Row 2: T = 2**
* **N = 53M:** The "Real" loss fluctuates around 2. The "Pred" loss is relatively constant at approximately 3.
* **N = 134M:** The "Real" loss starts high (around 10) and decreases to approximately 1. The "Pred" loss starts high (around 10) and decreases to approximately 1, closely following the "Real" loss.
* **N = 374M:** The "Real" loss starts high (around 4) and decreases to approximately 1. The "Pred" loss starts high (around 4) and decreases to approximately 1, closely following the "Real" loss.
* **N = 778M:** The "Real" loss starts high (around 4) and decreases to approximately 1. The "Pred" loss starts high (around 4) and decreases to approximately 1, closely following the "Real" loss.
* **N = 1.36B:** The "Real" loss starts high (around 4) and decreases to approximately 1. The "Pred" loss starts high (around 4) and decreases to approximately 1, closely following the "Real" loss.
**Row 3: T = 3**
* **N = 53M:** The "Real" loss fluctuates around 2. The "Pred" loss is relatively constant at approximately 3.
* **N = 134M:** The "Real" loss starts high (around 4) and decreases to approximately 1. The "Pred" loss starts high (around 4) and decreases to approximately 1, closely following the "Real" loss.
* **N = 374M:** The "Real" loss starts high (around 4) and decreases to approximately 1. The "Pred" loss starts high (around 4) and decreases to approximately 1, closely following the "Real" loss.
* **N = 778M:** The "Real" loss starts high (around 4) and decreases to approximately 1. The "Pred" loss starts high (around 4) and decreases to approximately 1, closely following the "Real" loss.
* **N = 1.36B:** The "Real" loss starts high (around 4) and decreases to approximately 1. The "Pred" loss starts high (around 4) and decreases to approximately 1, closely following the "Real" loss.
**Row 4: T = 4**
* **N = 53M:** The "Real" loss fluctuates around 2. The "Pred" loss is relatively constant at approximately 3.
* **N = 134M:** The "Real" loss starts high (around 4) and decreases to approximately 1. The "Pred" loss starts high (around 4) and decreases to approximately 1, closely following the "Real" loss.
* **N = 374M:** The "Real" loss starts high (around 4) and decreases to approximately 1. The "Pred" loss starts high (around 4) and decreases to approximately 1, closely following the "Real" loss.
* **N = 778M:** The "Real" loss starts high (around 4) and decreases to approximately 1. The "Pred" loss starts high (around 4) and decreases to approximately 1, closely following the "Real" loss.
* **N = 1.36B:** The "Real" loss starts high (around 4) and decreases to approximately 1. The "Pred" loss starts high (around 4) and decreases to approximately 1, closely following the "Real" loss.
### Key Observations
* For N = 53M, the "Real" loss is relatively constant and higher than the "Pred" loss, except for T=1 where the "Real" loss increases significantly.
* For N = 134M, 374M, 778M, and 1.36B, the "Real" and "Pred" losses are very similar, starting high and decreasing as Tokens(B) increases.
* As N increases, the "Real" and "Pred" losses tend to converge more closely.
* The "Pred" loss generally follows the trend of the "Real" loss, but with some discrepancies, especially when N = 53M.
### Interpretation
The charts illustrate the performance of a prediction model in terms of step-wise loss. The parameter 'T' might represent different training iterations or model configurations, while 'N' represents the size of the training dataset.
The data suggests that:
* Increasing the training dataset size (N) generally improves the model's ability to predict the loss accurately, as evidenced by the closer alignment of "Real" and "Pred" losses for larger N values.
* The model struggles to accurately predict the loss when the training dataset is small (N = 53M), particularly for certain configurations (T = 1).
* The model's performance is relatively stable across different training iterations or configurations (T = 2, 3, 4) for larger datasets.
* The initial high loss values, which decrease as Tokens(B) increases, indicate that the model learns and improves its predictions as it processes more tokens.
DECODING INTELLIGENCE...
EXPERT: nemotron-free VERSION 1
RUNTIME: free/nvidia/nemotron-nano-12b-v2-vl:free
INTEL_VERIFIED
## Line Graphs: Step-wise Loss vs. Tokens for Different Model Sizes and Training Steps
### Overview
The image contains a 4x3 grid of line graphs comparing "Real" (blue solid) and "Pred" (orange dashed) step-wise loss across varying model sizes (N) and training steps (T). Each graph tracks loss as tokens (B) increase from 0 to ~20B. Key parameters include T (1-4) and N (53M, 134M, 374M, 778M, 1.36B). All graphs share identical axes but differ in parameter combinations.
### Components/Axes
- **X-axis**: "Tokens(B)" (0 to 20B), labeled in increments of 5B.
- **Y-axis**: "Step-wise Loss" (0 to 10), labeled in increments of 2.
- **Legends**: Top-right corner of each graph. Blue = "Real", Orange dashed = "Pred".
- **Graph Titles**: Format: `T = [value], N = [value]` (e.g., "T = 1, N = 53M").
### Detailed Analysis
1. **T = 1, N = 53M**:
- Real loss: Sharp initial drop (~10 → 2) within 5B tokens, then plateaus.
- Pred loss: Gradual decline (~8 → 3) over 15B tokens, then stabilizes.
2. **T = 1, N = 134M**:
- Real loss: Steeper initial drop (~10 → 3) within 10B tokens, then fluctuates.
- Pred loss: Slight rise (~3 → 5) before dropping to ~2.
3. **T = 1, N = 374M**:
- Real loss: Rapid decline (~10 → 2) within 5B tokens, then stabilizes.
- Pred loss: Minimal change (~2 → 1.5) after initial rise.
4. **T = 1, N = 778M**:
- Real loss: Sharp drop (~10 → 2) within 5B tokens, then plateaus.
- Pred loss: Stable at ~2 after initial rise.
5. **T = 1, N = 1.36B**:
- Real loss: Steep decline (~10 → 2) within 5B tokens, then stabilizes.
- Pred loss: Slight rise (~2 → 3) before dropping to ~1.5.
6. **T = 2, N = 53M**:
- Real loss: Gradual decline (~10 → 4) over 10B tokens, then stabilizes.
- Pred loss: Sharp drop (~8 → 2) within 5B tokens, then plateaus.
7. **T = 2, N = 134M**:
- Real loss: Steady decline (~10 → 3) over 15B tokens.
- Pred loss: Minimal fluctuation (~2 → 1.8).
8. **T = 2, N = 374M**:
- Real loss: Rapid drop (~10 → 2) within 5B tokens, then stabilizes.
- Pred loss: Stable at ~1.5.
9. **T = 2, N = 778M**:
- Real loss: Sharp decline (~10 → 2) within 5B tokens, then plateaus.
- Pred loss: Stable at ~1.5.
10. **T = 2, N = 1.36B**:
- Real loss: Steep drop (~10 → 2) within 5B tokens, then stabilizes.
- Pred loss: Slight rise (~2 → 3) before dropping to ~1.5.
11. **T = 3, N = 53M**:
- Real loss: Gradual decline (~10 → 4) over 10B tokens, then stabilizes.
- Pred loss: Sharp drop (~8 → 2) within 5B tokens, then plateaus.
12. **T = 3, N = 134M**:
- Real loss: Steady decline (~10 → 3) over 15B tokens.
- Pred loss: Minimal fluctuation (~2 → 1.8).
13. **T = 3, N = 374M**:
- Real loss: Rapid drop (~10 → 2) within 5B tokens, then stabilizes.
- Pred loss: Stable at ~1.5.
14. **T = 3, N = 778M**:
- Real loss: Sharp decline (~10 → 2) within 5B tokens, then plateaus.
- Pred loss: Stable at ~1.5.
15. **T = 3, N = 1.36B**:
- Real loss: Steep drop (~10 → 2) within 5B tokens, then stabilizes.
- Pred loss: Slight rise (~2 → 3) before dropping to ~1.5.
16. **T = 4, N = 53M**:
- Real loss: Gradual decline (~10 → 4) over 10B tokens, then stabilizes.
- Pred loss: Sharp drop (~8 → 2) within 5B tokens, then plateaus.
17. **T = 4, N = 134M**:
- Real loss: Steady decline (~10 → 3) over 15B tokens.
- Pred loss: Minimal fluctuation (~2 → 1.8).
18. **T = 4, N = 374M**:
- Real loss: Rapid drop (~10 → 2) within 5B tokens, then stabilizes.
- Pred loss: Stable at ~1.5.
19. **T = 4, N = 778M**:
- Real loss: Sharp decline (~10 → 2) within 5B tokens, then plateaus.
- Pred loss: Stable at ~1.5.
20. **T = 4, N = 1.36B**:
- Real loss: Steep drop (~10 → 2) within 5B tokens, then stabilizes.
- Pred loss: Slight rise (~2 → 3) before dropping to ~1.5.
### Key Observations
- **Real Loss**: Consistently drops sharply (often ~10 → 2) within 5B tokens for larger N (134M+), then plateaus. Smaller N (53M) shows slower convergence.
- **Pred Loss**: Generally stabilizes at ~1.5–2 across all N, with minor fluctuations. Larger N shows faster convergence.
- **T Impact**: Higher T (3–4) correlates with more stable Real loss plateaus but increased Pred loss variability in smaller N.
- **Anomalies**: T=4, N=53M shows slower Real loss convergence compared to T=1–3.
### Interpretation
The graphs demonstrate that larger model sizes (N) achieve faster Real loss reduction, particularly at T=1–2. The Pred loss, likely from model averaging, remains stable across N but shows minor sensitivity to T. The sharp initial drops in Real loss suggest effective early training phases, while plateaus indicate convergence limits. T=4’s slower convergence for small N hints at diminishing returns or optimization challenges in later training steps. The Pred line’s consistency implies robust prediction models, though its slight rise in large N at T=1–4 warrants investigation into model calibration.
DECODING INTELLIGENCE...