## Step-wise Loss Chart: Real vs. Predicted
### Overview
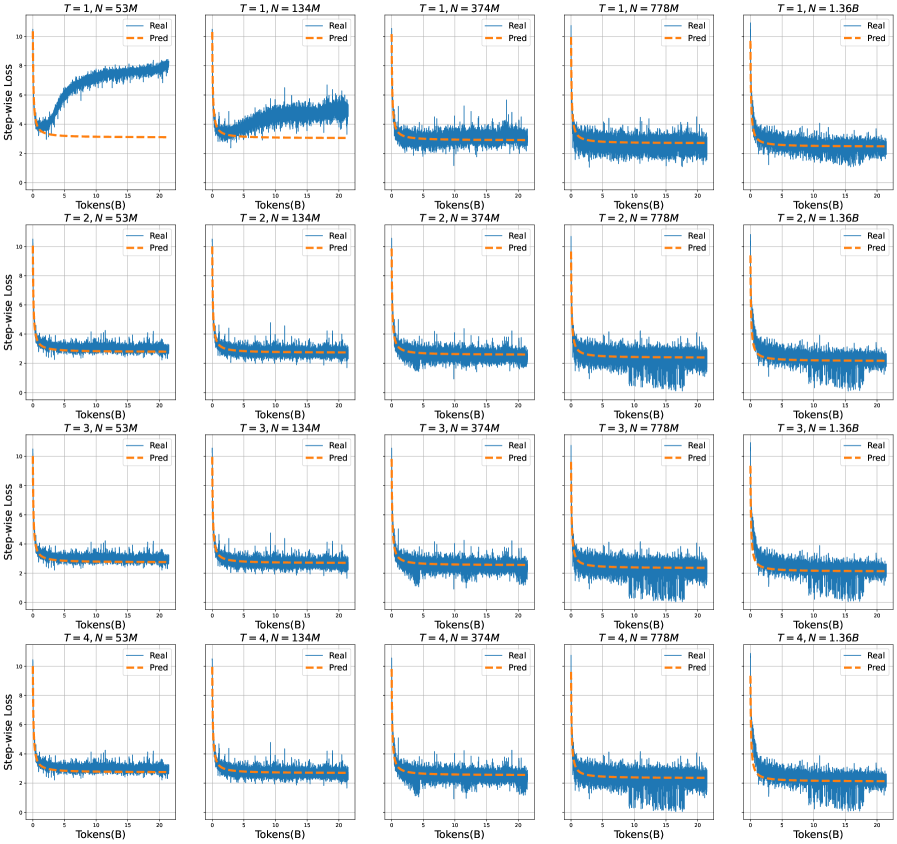
The image presents a grid of 20 line charts, arranged in a 4x5 matrix. Each chart displays the "Step-wise Loss" as a function of "Tokens(B)". The charts compare "Real" (actual) loss values against "Pred" (predicted) loss values. The charts are organized by two parameters: 'T' (rows, ranging from 1 to 4) and 'N' (columns, ranging from 53M to 1.36B).
### Components/Axes
* **Y-axis (Step-wise Loss):** Ranges from 0 to 10.
* **X-axis (Tokens(B)):** Ranges from 0 to 20.
* **Chart Titles:** Each chart has a title in the format "T = [value], N = [value]", where T ranges from 1 to 4 and N takes values 53M, 134M, 374M, 778M, and 1.36B.
* **Legend:** Each chart includes a legend in the top-right corner, indicating "Real" (blue line) and "Pred" (orange dashed line).
### Detailed Analysis
**Row 1: T = 1**
* **N = 53M:** The "Real" loss starts around 4, increases to approximately 8 around Tokens(B) = 5, and then stabilizes around 8. The "Pred" loss is relatively constant at approximately 3.
* **N = 134M:** The "Real" loss starts high (around 10) and decreases to approximately 2. The "Pred" loss starts high (around 10) and decreases to approximately 2, closely following the "Real" loss.
* **N = 374M:** The "Real" loss starts high (around 4) and decreases to approximately 1. The "Pred" loss starts high (around 4) and decreases to approximately 1, closely following the "Real" loss.
* **N = 778M:** The "Real" loss starts high (around 4) and decreases to approximately 1. The "Pred" loss starts high (around 4) and decreases to approximately 1, closely following the "Real" loss.
* **N = 1.36B:** The "Real" loss starts high (around 4) and decreases to approximately 1. The "Pred" loss starts high (around 4) and decreases to approximately 1, closely following the "Real" loss.
**Row 2: T = 2**
* **N = 53M:** The "Real" loss fluctuates around 2. The "Pred" loss is relatively constant at approximately 3.
* **N = 134M:** The "Real" loss starts high (around 10) and decreases to approximately 1. The "Pred" loss starts high (around 10) and decreases to approximately 1, closely following the "Real" loss.
* **N = 374M:** The "Real" loss starts high (around 4) and decreases to approximately 1. The "Pred" loss starts high (around 4) and decreases to approximately 1, closely following the "Real" loss.
* **N = 778M:** The "Real" loss starts high (around 4) and decreases to approximately 1. The "Pred" loss starts high (around 4) and decreases to approximately 1, closely following the "Real" loss.
* **N = 1.36B:** The "Real" loss starts high (around 4) and decreases to approximately 1. The "Pred" loss starts high (around 4) and decreases to approximately 1, closely following the "Real" loss.
**Row 3: T = 3**
* **N = 53M:** The "Real" loss fluctuates around 2. The "Pred" loss is relatively constant at approximately 3.
* **N = 134M:** The "Real" loss starts high (around 4) and decreases to approximately 1. The "Pred" loss starts high (around 4) and decreases to approximately 1, closely following the "Real" loss.
* **N = 374M:** The "Real" loss starts high (around 4) and decreases to approximately 1. The "Pred" loss starts high (around 4) and decreases to approximately 1, closely following the "Real" loss.
* **N = 778M:** The "Real" loss starts high (around 4) and decreases to approximately 1. The "Pred" loss starts high (around 4) and decreases to approximately 1, closely following the "Real" loss.
* **N = 1.36B:** The "Real" loss starts high (around 4) and decreases to approximately 1. The "Pred" loss starts high (around 4) and decreases to approximately 1, closely following the "Real" loss.
**Row 4: T = 4**
* **N = 53M:** The "Real" loss fluctuates around 2. The "Pred" loss is relatively constant at approximately 3.
* **N = 134M:** The "Real" loss starts high (around 4) and decreases to approximately 1. The "Pred" loss starts high (around 4) and decreases to approximately 1, closely following the "Real" loss.
* **N = 374M:** The "Real" loss starts high (around 4) and decreases to approximately 1. The "Pred" loss starts high (around 4) and decreases to approximately 1, closely following the "Real" loss.
* **N = 778M:** The "Real" loss starts high (around 4) and decreases to approximately 1. The "Pred" loss starts high (around 4) and decreases to approximately 1, closely following the "Real" loss.
* **N = 1.36B:** The "Real" loss starts high (around 4) and decreases to approximately 1. The "Pred" loss starts high (around 4) and decreases to approximately 1, closely following the "Real" loss.
### Key Observations
* For N = 53M, the "Real" loss is relatively constant and higher than the "Pred" loss, except for T=1 where the "Real" loss increases significantly.
* For N = 134M, 374M, 778M, and 1.36B, the "Real" and "Pred" losses are very similar, starting high and decreasing as Tokens(B) increases.
* As N increases, the "Real" and "Pred" losses tend to converge more closely.
* The "Pred" loss generally follows the trend of the "Real" loss, but with some discrepancies, especially when N = 53M.
### Interpretation
The charts illustrate the performance of a prediction model in terms of step-wise loss. The parameter 'T' might represent different training iterations or model configurations, while 'N' represents the size of the training dataset.
The data suggests that:
* Increasing the training dataset size (N) generally improves the model's ability to predict the loss accurately, as evidenced by the closer alignment of "Real" and "Pred" losses for larger N values.
* The model struggles to accurately predict the loss when the training dataset is small (N = 53M), particularly for certain configurations (T = 1).
* The model's performance is relatively stable across different training iterations or configurations (T = 2, 3, 4) for larger datasets.
* The initial high loss values, which decrease as Tokens(B) increases, indicate that the model learns and improves its predictions as it processes more tokens.