# Technical Data Extraction: Performance Heatmaps
This document contains a detailed extraction of three heatmaps representing performance metrics for a machine learning model across different configurations of "Shot" (y-axis) and "Doc" (x-axis).
## 1. Document Overview
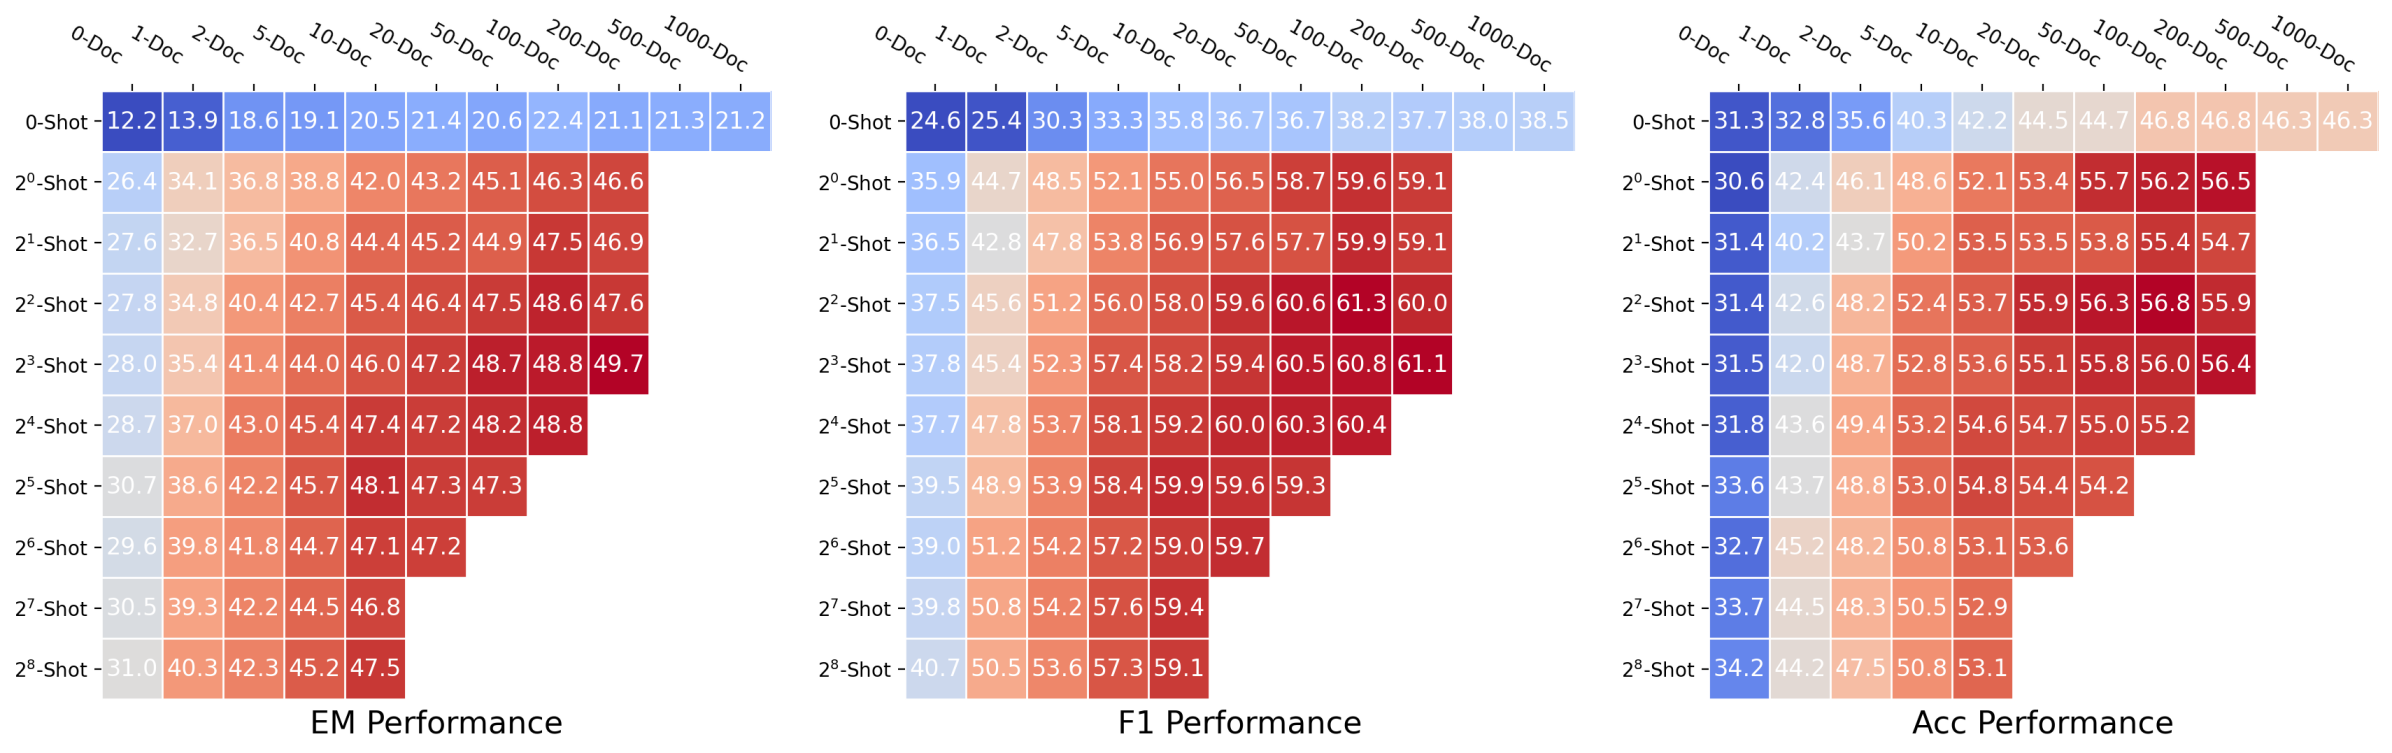
The image consists of three distinct heatmaps arranged horizontally. Each heatmap shares the same axes but represents a different performance metric:
* **Left:** EM Performance (Exact Match)
* **Center:** F1 Performance
* **Right:** Acc Performance (Accuracy)
### Shared Axis Definitions
* **X-Axis (Top):** Number of Documents ("Doc"). Values: 0-Doc, 1-Doc, 2-Doc, 5-Doc, 10-Doc, 20-Doc, 50-Doc, 100-Doc, 200-Doc, 500-Doc, 1000-Doc.
* **Y-Axis (Left):** Number of Shots. Values: 0-Shot, $2^0$-Shot, $2^1$-Shot, $2^2$-Shot, $2^3$-Shot, $2^4$-Shot, $2^5$-Shot, $2^6$-Shot, $2^7$-Shot, $2^8$-Shot.
* **Color Gradient:** Blue (Lower values) $\rightarrow$ White (Mid-range) $\rightarrow$ Red (Higher values).
---
## 2. Data Tables
### Table 1: EM Performance
**Trend Analysis:** Performance generally increases as both the number of documents and shots increase. The highest performance is concentrated in the bottom-right of the populated cells (around $2^3$-Shot and 200-Doc).
| Shot / Doc | 0-Doc | 1-Doc | 2-Doc | 5-Doc | 10-Doc | 20-Doc | 50-Doc | 100-Doc | 200-Doc | 500-Doc | 1000-Doc |
| :--- | :--- | :--- | :--- | :--- | :--- | :--- | :--- | :--- | :--- | :--- | :--- |
| **0-Shot** | 12.2 | 13.9 | 18.6 | 19.1 | 20.5 | 21.4 | 20.6 | 22.4 | 21.1 | - | - |