## Log-Log Plot: Number of MC Steps vs. Dimension
### Overview
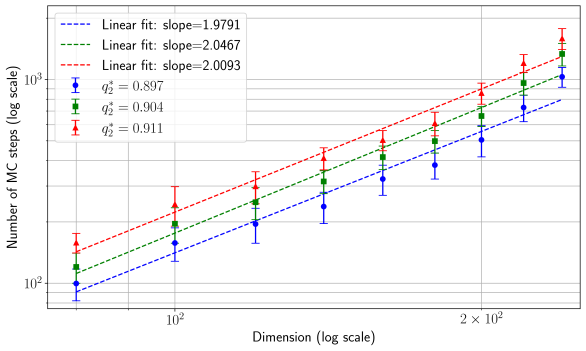
The image is a log-log plot showing the relationship between the number of Monte Carlo (MC) steps and the dimension, for three different values of a parameter denoted as q₂*. The plot includes linear fits for each data series, along with their corresponding slopes. Error bars are present on each data point.
### Components/Axes
* **X-axis:** Dimension (log scale). Axis markers are at 10², and 2 x 10².
* **Y-axis:** Number of MC steps (log scale). Axis markers are at 10² and 10³.
* **Legend (top-left):**
* Blue dashed line: Linear fit: slope = 1.9791
* Green dashed line: Linear fit: slope = 2.0467
* Red dashed line: Linear fit: slope = 2.0093
* Blue square: q₂* = 0.897
* Green square: q₂* = 0.904
* Red triangle: q₂* = 0.911
### Detailed Analysis
* **Data Points:** The data points are plotted with error bars. The x-axis values appear to be approximately 50, 100, 150, and 200.
* **Blue Data Series (q₂* = 0.897):**
* Trend: The blue data series shows an upward trend.
* Data Points: Approximate y-values for x = 50, 100, 150, and 200 are 100, 200, 500, and 1000.
* Linear Fit: The blue dashed line represents the linear fit with a slope of 1.9791.
* **Green Data Series (q₂* = 0.904):**
* Trend: The green data series shows an upward trend.
* Data Points: Approximate y-values for x = 50, 100, 150, and 200 are 120, 300, 600, and 1200.
* Linear Fit: The green dashed line represents the linear fit with a slope of 2.0467.
* **Red Data Series (q₂* = 0.911):**
* Trend: The red data series shows an upward trend.
* Data Points: Approximate y-values for x = 50, 100, 150, and 200 are 150, 350, 700, and 1400.
* Linear Fit: The red dashed line represents the linear fit with a slope of 2.0093.
### Key Observations
* All three data series exhibit a positive correlation between the dimension and the number of MC steps.
* The slopes of the linear fits are all close to 2, suggesting a power-law relationship.
* The data series for q₂* = 0.911 consistently shows a higher number of MC steps compared to the other two series for a given dimension.
* The data series for q₂* = 0.897 consistently shows a lower number of MC steps compared to the other two series for a given dimension.
* The error bars appear to be relatively consistent across all data points.
### Interpretation
The plot demonstrates that the number of Monte Carlo steps required increases with the dimension, following a power-law relationship. The parameter q₂* influences the magnitude of the number of MC steps, with higher values of q₂* resulting in a greater number of steps for a given dimension. The slopes of the linear fits being close to 2 suggests that the number of MC steps scales approximately with the square of the dimension. This information is useful for understanding the computational cost associated with Monte Carlo simulations in different dimensions and for optimizing the choice of parameters like q₂*.