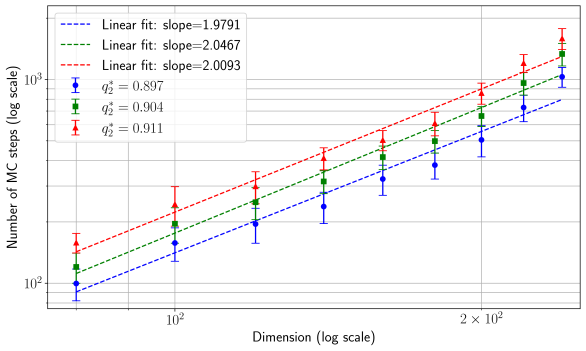
## Scatter Plot: Monte Carlo Steps vs. Dimension
### Overview
The image presents a scatter plot illustrating the relationship between the number of Monte Carlo (MC) steps (on a logarithmic scale) and the dimension (also on a logarithmic scale). Three different data series are plotted, each represented by a different color and line style, with error bars indicating uncertainty. Linear fits are shown for each series, with their respective slopes indicated.
### Components/Axes
* **X-axis:** Dimension (log scale), ranging from approximately 10^1 to 2 x 10^2.
* **Y-axis:** Number of MC steps (log scale), ranging from approximately 10^1 to 10^3.
* **Data Series 1:** Blue dashed line, labeled "Linear fit: slope=1.9791", with associated data points and error bars.
* **Data Series 2:** Green solid line, labeled "Linear fit: slope=2.0467", with associated data points and error bars.
* **Data Series 3:** Red dashed-dotted line, labeled "Linear fit: slope=2.0093", with associated data points and error bars.
* **Legend:** Located in the top-left corner, providing color-coding and R^2 values for each data series:
* Blue: q^2 = 0.897
* Green: q^2 = 0.904
* Red: q^2 = 0.911
* **Grid:** A grid is present in the background to aid in reading values.
### Detailed Analysis
Let's analyze each data series individually:
**Data Series 1 (Blue):**
The blue line shows an upward trend, indicating that as the dimension increases, the number of MC steps also increases. The line is approximately linear.
* Approximate data points (with error bars):
* Dimension ≈ 10^1: Number of MC steps ≈ 10^1.5 (error bar ≈ ± 0.3)
* Dimension ≈ 50: Number of MC steps ≈ 200 (error bar ≈ ± 40)
* Dimension ≈ 100: Number of MC steps ≈ 400 (error bar ≈ ± 50)
* Dimension ≈ 200: Number of MC steps ≈ 800 (error bar ≈ ± 100)
**Data Series 2 (Green):**
The green line also exhibits an upward trend, steeper than the blue line. It is approximately linear.
* Approximate data points (with error bars):
* Dimension ≈ 10^1: Number of MC steps ≈ 150 (error bar ≈ ± 20)
* Dimension ≈ 50: Number of MC steps ≈ 300 (error bar ≈ ± 50)
* Dimension ≈ 100: Number of MC steps ≈ 600 (error bar ≈ ± 70)
* Dimension ≈ 200: Number of MC steps ≈ 1200 (error bar ≈ ± 150)
**Data Series 3 (Red):**
The red line shows an upward trend, similar to the green line, but with larger error bars. It is approximately linear.
* Approximate data points (with error bars):
* Dimension ≈ 10^1: Number of MC steps ≈ 200 (error bar ≈ ± 50)
* Dimension ≈ 50: Number of MC steps ≈ 400 (error bar ≈ ± 100)
* Dimension ≈ 100: Number of MC steps ≈ 800 (error bar ≈ ± 150)
* Dimension ≈ 200: Number of MC steps ≈ 1600 (error bar ≈ ± 300)
### Key Observations
* All three data series demonstrate a positive correlation between dimension and the number of MC steps required.
* The slopes of the linear fits are relatively similar (around 2), suggesting a roughly linear relationship.
* The red data series has the largest error bars, indicating greater uncertainty in its measurements.
* The R^2 values are all high (around 0.9), indicating that the linear fits are reasonably good representations of the data.
* The green line consistently lies above the blue line, and the red line is generally above both.
### Interpretation
The data suggests that the computational cost of the Monte Carlo simulation (as measured by the number of steps) increases with the dimensionality of the problem. The approximately linear relationship indicates that the cost scales roughly linearly with dimension. The different data series likely represent different configurations or algorithms within the Monte Carlo simulation. The higher slopes and R^2 values for the green and red series suggest they may be more efficient or require more steps for a given dimension compared to the blue series. The error bars indicate the variability in the measurements, and the larger error bars for the red series suggest that the results for that series are less precise. The high R^2 values suggest that the linear model is a good approximation of the underlying relationship, but it's important to note that this is an approximation and may not hold true for all dimensions. The data implies that as the dimensionality of the problem increases, the computational resources required for the Monte Carlo simulation will also increase, potentially limiting the applicability of the method to high-dimensional problems.