## Scatter Plot with Linear Fits: Dimension vs. Number of Monte Carlo Stops
### Overview
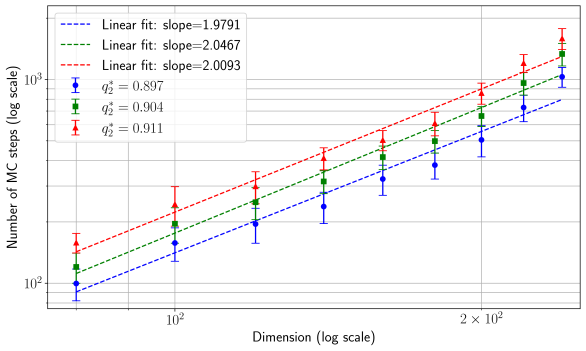
The image is a scatter plot on a log-log scale, displaying the relationship between "Dimension" (x-axis) and the "Number of MC stops" (y-axis). Three distinct data series are plotted, each with error bars and a corresponding linear fit line. The chart demonstrates a power-law relationship between the variables.
### Components/Axes
* **Chart Type:** Scatter plot with error bars and linear regression lines.
* **X-Axis:**
* **Label:** `Dimension (log scale)`
* **Scale:** Logarithmic. Major tick marks are visible at `10^2` (100) and `2 x 10^2` (200). The axis spans approximately from 50 to 250.
* **Y-Axis:**
* **Label:** `Number of MC stops (log scale)`
* **Scale:** Logarithmic. Major tick marks are visible at `10^2` (100) and `10^3` (1000). The axis spans approximately from 80 to 2000.
* **Legend (Top-Left Corner):**
* **Blue Dashed Line:** `Linear fit: slope=1.9791`
* **Green Dashed Line:** `Linear fit: slope=2.0467`
* **Red Dashed Line:** `Linear fit: slope=2.0093`
* **Blue Circle Marker:** `q² = 0.897`
* **Green Square Marker:** `q² = 0.904`
* **Red Triangle Marker:** `q² = 0.911`
* **Data Series:** Each series consists of data points with vertical error bars, plotted at the same set of dimension values.
### Detailed Analysis
**Data Series & Trends:**
1. **Blue Series (Circles):**
* **Trend:** The data points follow a clear upward linear trend on the log-log plot. The fitted line has a slope of **1.9791**.
* **Data Points (Approximate):**
* Dimension ~60: MC stops ~90 (Error bar range: ~80-100)
* Dimension ~80: MC stops ~130 (Error bar range: ~115-145)
* Dimension ~100: MC stops ~180 (Error bar range: ~160-200)
* Dimension ~130: MC stops ~250 (Error bar range: ~220-280)
* Dimension ~160: MC stops ~350 (Error bar range: ~310-390)
* Dimension ~200: MC stops ~480 (Error bar range: ~420-540)
* Dimension ~250: MC stops ~650 (Error bar range: ~570-730)
* **Goodness of Fit:** `q² = 0.897`.
2. **Green Series (Squares):**
* **Trend:** The data points follow a clear upward linear trend, positioned above the blue series. The fitted line has a slope of **2.0467**.
* **Data Points (Approximate):**
* Dimension ~60: MC stops ~120 (Error bar range: ~105-135)
* Dimension ~80: MC stops ~170 (Error bar range: ~150-190)
* Dimension ~100: MC stops ~240 (Error bar range: ~210-270)
* Dimension ~130: MC stops ~340 (Error bar range: ~300-380)
* Dimension ~160: MC stops ~470 (Error bar range: ~410-530)
* Dimension ~200: MC stops ~650 (Error bar range: ~570-730)
* Dimension ~250: MC stops ~880 (Error bar range: ~770-990)
* **Goodness of Fit:** `q² = 0.904`.
3. **Red Series (Triangles):**
* **Trend:** The data points follow a clear upward linear trend, positioned highest on the chart. The fitted line has a slope of **2.0093**.
* **Data Points (Approximate):**
* Dimension ~60: MC stops ~150 (Error bar range: ~130-170)
* Dimension ~80: MC stops ~220 (Error bar range: ~190-250)
* Dimension ~100: MC stops ~310 (Error bar range: ~270-350)
* Dimension ~130: MC stops ~440 (Error bar range: ~380-500)
* Dimension ~160: MC stops ~620 (Error bar range: ~540-700)
* Dimension ~200: MC stops ~860 (Error bar range: ~750-970)
* Dimension ~250: MC stops ~1150 (Error bar range: ~1000-1300)
* **Goodness of Fit:** `q² = 0.911`.
### Key Observations
1. **Consistent Power-Law Scaling:** All three series exhibit a near-perfect linear relationship on the log-log plot, indicating a power-law relationship: `Number of MC stops ∝ Dimension^k`. The fitted slopes (`k`) are all very close to **2** (ranging from 1.9791 to 2.0467).
2. **Hierarchy of Series:** The red series (triangles) consistently requires the highest number of MC stops for a given dimension, followed by the green series (squares), and then the blue series (circles).
3. **High Goodness of Fit:** The `q²` values for all fits are high (0.897 to 0.911), indicating the linear models explain the data variance very well.
4. **Increasing Variance:** The vertical error bars appear to grow in absolute size as the dimension (and consequently the number of MC stops) increases, which is typical for multiplicative or proportional error.
### Interpretation
The data strongly suggests that the computational cost (measured in Monte Carlo stops) of the process being studied scales **quadratically** with the problem dimension (`~Dimension^2`). This is a fundamental scaling law for the algorithm or system under test.
The three distinct series likely represent different parameter settings, algorithms, or problem instances. The consistent vertical offset between them (red > green > blue) indicates a constant multiplicative factor in their cost. For example, the red setting might be more accurate or complex, requiring roughly 1.5 times more stops than the blue setting at any given dimension.
The high `q²` values and clear trends provide reliable evidence for this quadratic scaling. The increasing error bars suggest that the absolute uncertainty in the number of required stops grows with the problem size, which is an important consideration for resource allocation and prediction in large-scale applications. The chart effectively communicates that doubling the dimension will approximately quadruple the required computational effort.