## Line Graph: Relationship Between Dimension and Number of MC Steps
### Overview
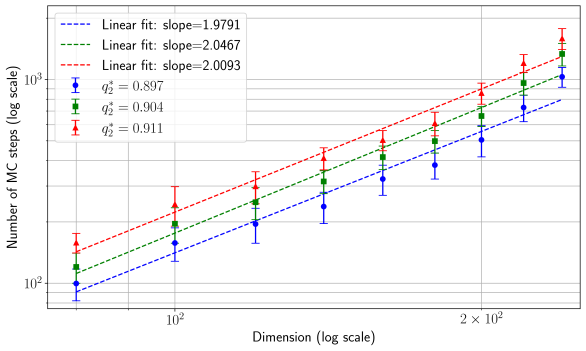
The image is a line graph depicting the relationship between "Dimension" (log scale) and "Number of MC steps" (log scale). Three distinct linear fits are plotted, each with a unique slope and associated statistical value (q₂). Data points with error bars are overlaid on the lines, and a legend explains the color-coded trends.
### Components/Axes
- **X-axis**: "Dimension (log scale)" ranging from 10² to 2×10².
- **Y-axis**: "Number of MC steps (log scale)" ranging from 10² to 10³.
- **Legend**: Located in the top-left corner, with three entries:
- **Blue dashed line**: Slope = 1.9791, q₂ = 0.897.
- **Green dashed line**: Slope = 2.0467, q₂ = 0.904.
- **Red dashed line**: Slope = 2.0093, q₂ = 0.911.
- **Data Points**: Blue circles, green squares, and red triangles correspond to the three lines, with error bars indicating variability.
### Detailed Analysis
1. **Blue Line (Slope = 1.9791)**:
- Data points (blue circles) align closely with the dashed line.
- q₂ = 0.897 suggests moderate statistical confidence.
- Error bars are smallest at lower dimensions, increasing slightly at higher dimensions.
2. **Green Line (Slope = 2.0467)**:
- Data points (green squares) follow the dashed line with minor deviations.
- q₂ = 0.904 indicates slightly higher confidence than the blue line.
- Error bars are consistent across dimensions.
3. **Red Line (Slope = 2.0093)**:
- Data points (red triangles) closely match the dashed line.
- q₂ = 0.911 is the highest, suggesting the most reliable trend.
- Error bars are moderate, with slight increases at higher dimensions.
### Key Observations
- All three lines exhibit **positive linear trends** on log-log scales, indicating exponential growth of MC steps with dimension.
- The **red line** (slope = 2.0093) has the steepest slope and highest q₂, suggesting the strongest correlation between dimension and MC steps.
- The **blue line** (slope = 1.9791) has the shallowest slope and lowest q₂, indicating weaker correlation.
- Error bars are smallest for the blue line at lower dimensions but grow larger for all lines as dimension increases.
### Interpretation
The graph demonstrates that the number of Monte Carlo (MC) steps required scales exponentially with dimension, with distinct trends for different parameters (represented by slopes and q₂ values). The red line’s higher slope and q₂ suggest it may correspond to a more computationally intensive or sensitive model. The log-log scale emphasizes the exponential relationship, while error bars highlight variability in measurements. The differences in q₂ values imply varying levels of statistical confidence across the models, with the red line being the most robust. This could reflect differences in algorithmic efficiency, system complexity, or parameter tuning in the underlying simulations.