## Horizontal Bar Chart: CiteME Paper Tags
### Overview
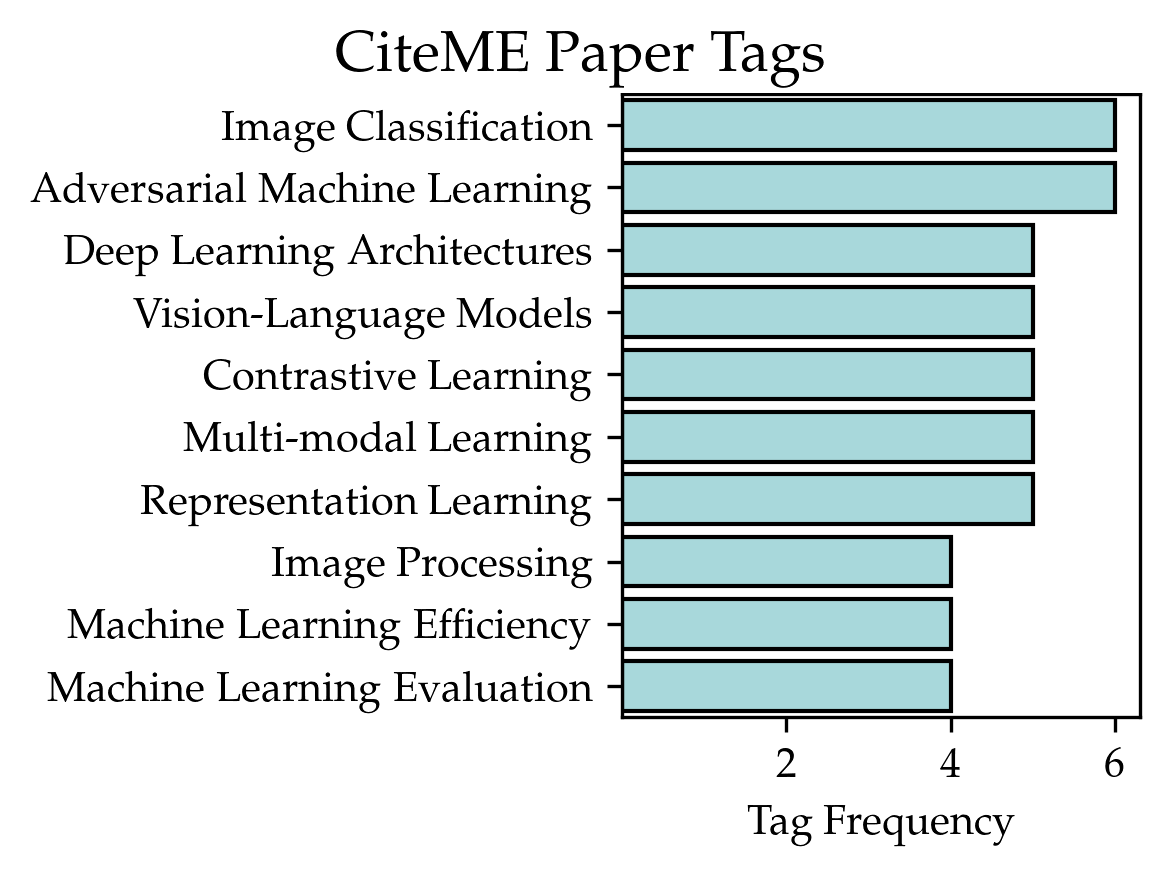
The image is a horizontal bar chart titled "CiteME Paper Tags". It displays the frequency of different tags associated with research papers. The tags are listed on the vertical axis, and the tag frequency is represented on the horizontal axis. The bars are light blue with black borders.
### Components/Axes
* **Title:** CiteME Paper Tags
* **Vertical Axis (Tags):**
* Image Classification
* Adversarial Machine Learning
* Deep Learning Architectures
* Vision-Language Models
* Contrastive Learning
* Multi-modal Learning
* Representation Learning
* Image Processing
* Machine Learning Efficiency
* Machine Learning Evaluation
* **Horizontal Axis (Tag Frequency):**
* Scale: 0 to 6
* Markers: 2, 4, 6
* Label: Tag Frequency
### Detailed Analysis
Here's a breakdown of the tag frequencies based on the bar lengths:
* **Image Classification:** Approximately 5.8
* **Adversarial Machine Learning:** Approximately 5.6
* **Deep Learning Architectures:** Approximately 5.0
* **Vision-Language Models:** Approximately 4.8
* **Contrastive Learning:** Approximately 4.7
* **Multi-modal Learning:** Approximately 4.6
* **Representation Learning:** Approximately 4.5
* **Image Processing:** Approximately 4.0
* **Machine Learning Efficiency:** Approximately 3.9
* **Machine Learning Evaluation:** Approximately 3.8
### Key Observations
* "Image Classification" and "Adversarial Machine Learning" are the most frequent tags, with frequencies close to 6.
* The tag frequencies generally decrease as you move down the list, with "Machine Learning Evaluation" having the lowest frequency.
* The top 7 tags have frequencies above 4.5, while the bottom 3 are below 4.0.
### Interpretation
The bar chart provides insights into the prevalent research areas within the CiteME paper collection. "Image Classification" and "Adversarial Machine Learning" are the most popular topics, suggesting a strong focus on these areas. The decreasing trend in tag frequency indicates a hierarchy of research interest, with some topics receiving more attention than others. The chart highlights the relative importance of different machine learning subfields within the CiteME paper dataset.