\n
## Horizontal Bar Chart: CiteME Paper Tags
### Overview
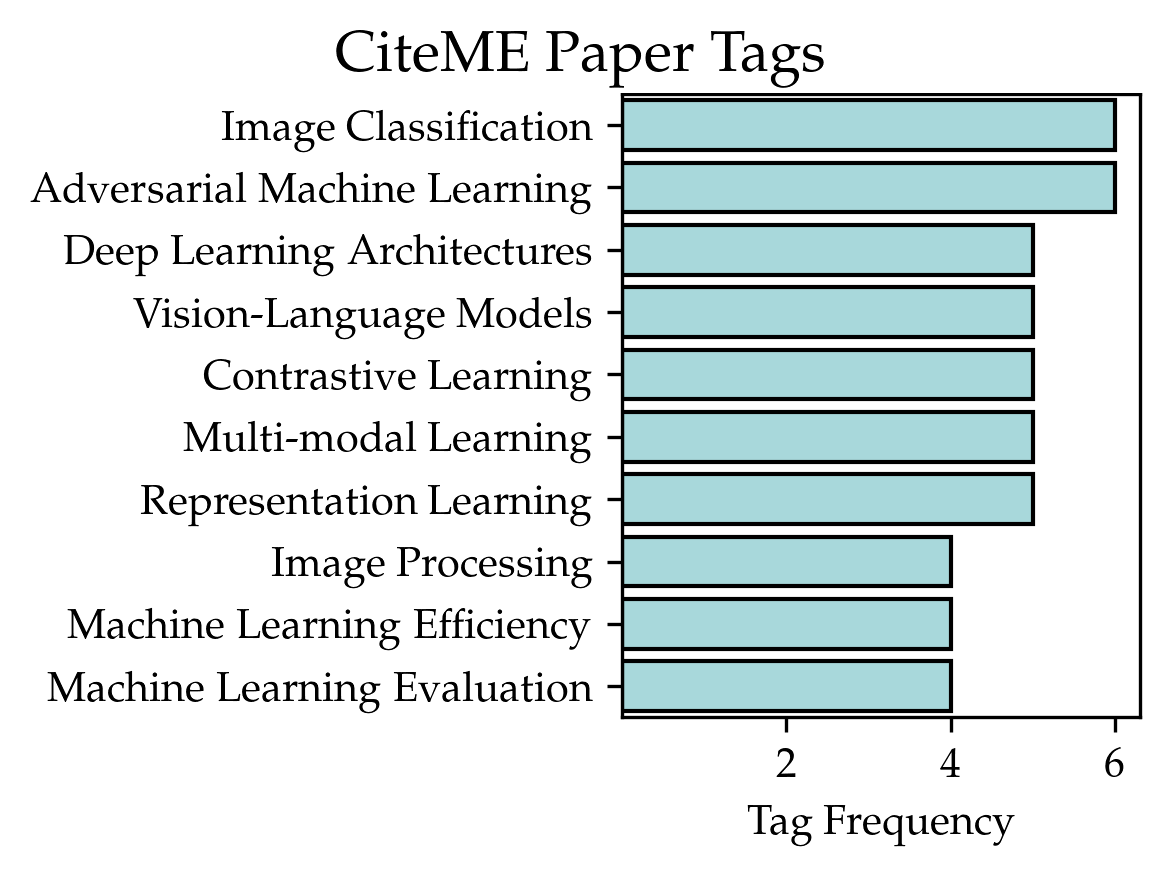
This image is a horizontal bar chart titled "CiteME Paper Tags." It displays the frequency of ten distinct research topic tags associated with papers in the "CiteME" dataset or system. The chart uses a single color for all bars, indicating a simple frequency count without sub-grouping.
### Components/Axes
* **Title:** "CiteME Paper Tags" (centered at the top).
* **Y-Axis (Vertical):** Lists the ten paper tag categories. From top to bottom:
1. Image Classification
2. Adversarial Machine Learning
3. Deep Learning Architectures
4. Vision-Language Models
5. Contrastive Learning
6. Multi-modal Learning
7. Representation Learning
8. Image Processing
9. Machine Learning Efficiency
10. Machine Learning Evaluation
* **X-Axis (Horizontal):** Labeled "Tag Frequency." It has numerical markers at 2, 4, and 6. The axis line extends from 0 to just beyond 6.
* **Legend:** There is no separate legend. All bars are rendered in the same light blue/teal color with a black outline.
* **Data Representation:** Ten horizontal bars, each corresponding to a tag on the Y-axis. The length of each bar indicates its frequency.
### Detailed Analysis
The chart presents a ranked list of tag frequencies. The bars are ordered from highest frequency at the top to lowest at the bottom.
* **Top Tier (Frequency = 6):**
* `Image Classification`: Bar extends to the '6' marker.
* `Adversarial Machine Learning`: Bar extends to the '6' marker.
* **Middle Tier (Frequency = 5):**
* `Deep Learning Architectures`: Bar ends approximately halfway between the '4' and '6' markers.
* `Vision-Language Models`: Bar ends approximately halfway between the '4' and '6' markers.
* `Contrastive Learning`: Bar ends approximately halfway between the '4' and '6' markers.
* `Multi-modal Learning`: Bar ends approximately halfway between the '4' and '6' markers.
* `Representation Learning`: Bar ends approximately halfway between the '4' and '6' markers.
* **Lower Tier (Frequency = 4):**
* `Image Processing`: Bar extends to the '4' marker.
* `Machine Learning Efficiency`: Bar extends to the '4' marker.
* `Machine Learning Evaluation`: Bar extends to the '4' marker.
**Trend Verification:** The visual trend is a clear step-down pattern. The top two bars are the longest and equal. The next five bars are of equal, slightly shorter length. The final three bars are the shortest and equal. This creates three distinct frequency clusters.
### Key Observations
1. **Dominant Topics:** "Image Classification" and "Adversarial Machine Learning" are the most frequently tagged topics, tied for the highest frequency.
2. **Core Research Cluster:** A large middle group of five topics (Deep Learning Architectures, Vision-Language Models, Contrastive Learning, Multi-modal Learning, Representation Learning) all share the same, slightly lower frequency. This suggests these are all core, well-represented areas within the dataset.
3. **Foundational/Supporting Topics:** The three least frequent tags ("Image Processing," "Machine Learning Efficiency," "Machine Learning Evaluation") are all at the same level. These may represent more foundational, methodological, or evaluation-focused aspects of the research.
4. **Visual Design:** The chart uses a minimalist design with a single color, focusing attention purely on the rank and magnitude of the frequencies. The lack of a legend is appropriate as there is only one data series.
### Interpretation
The data suggests the "CiteME" paper collection is heavily focused on computer vision and robustness in machine learning. The top tag, "Image Classification," is a classic, central task in computer vision. Its tie with "Adversarial Machine Learning" indicates a strong concurrent emphasis on the security, robustness, and vulnerability of these models.
The large middle cluster represents the modern toolkit and paradigms of the field: building new architectures (`Deep Learning Architectures`), learning from multiple data types (`Vision-Language Models`, `Multi-modal Learning`), and developing advanced training objectives (`Contrastive Learning`, `Representation Learning`). Their equal frequency implies a balanced representation of these interconnected research directions.
The lower frequency of tags like "Image Processing" (a more traditional field) and "Machine Learning Efficiency"/"Evaluation" suggests that while these are necessary components, the primary research energy in this dataset is directed towards developing new models, tasks, and learning paradigms rather than low-level processing or optimization/assessment techniques. The chart effectively maps the landscape of a research community or corpus, highlighting its primary interests and the relative weight given to different sub-disciplines.