## Heatmap Grid: Parameter Space Analysis
### Overview
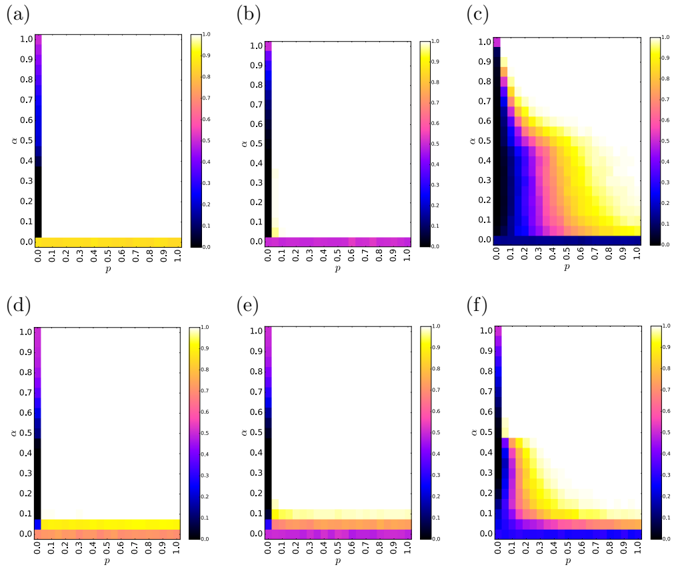
The image presents a grid of six heatmaps, arranged in a 2x3 layout. Each heatmap visualizes a function's output across a two-dimensional parameter space, where the x-axis represents the parameter 'p' and the y-axis represents the parameter 'c'. The color intensity indicates the function's value, ranging from dark blue (low) to bright yellow (high), as indicated by the color bar legend present in each subplot. The heatmaps appear to represent different conditions or variations of the same underlying system.
### Components/Axes
Each heatmap has the following components:
* **X-axis:** Labeled 'p', ranging from 0.0 to 1.0 in increments of 0.1.
* **Y-axis:** Labeled 'c', ranging from 0.0 to 1.0 in increments of 0.1.
* **Color Bar:** Located on the right side of each heatmap, indicating the value range from 0.0 (dark blue) to 1.0 (bright yellow).
* **Titles:** Each heatmap is labeled with a letter: (a), (b), (c), (d), (e), and (f).
### Detailed Analysis
**Heatmap (a):**
* The entire heatmap is uniformly dark blue, indicating a value close to 0.0 across the entire parameter space.
**Heatmap (b):**
* Similar to (a), the heatmap is predominantly dark blue. There is a very thin line of purple/pink along the bottom edge (c=0.0), indicating a slightly higher value, approximately 0.1-0.2.
**Heatmap (c):**
* A more complex pattern is visible. The lower-left region (low 'p' and low 'c') is dark blue. As 'c' increases, the values increase, transitioning through purple, pink, orange, and yellow. The top-right region (high 'p' and high 'c') shows a mix of yellow and orange. The bottom right corner (high 'p', low 'c') is dark blue.
* Specifically, for p values between 0.0 and 0.2, the value increases significantly as 'c' increases from 0.0 to approximately 0.5, then remains relatively high (yellow/orange) for higher 'c' values. For higher 'p' values (0.6 to 1.0), the value remains low (dark blue) regardless of the 'c' value.
**Heatmap (d):**
* Similar to (a) and (b), the heatmap is mostly dark blue. A thin yellow line is present along the bottom edge (c=0.0), indicating a value close to 1.0.
**Heatmap (e):**
* Similar to (d), the heatmap is mostly dark blue. A thin band of purple/pink/yellow is present along the bottom edge (c=0.0), indicating a value between 0.1 and 1.0.
**Heatmap (f):**
* The lower-left region (low 'p' and low 'c') is dark blue. As 'c' increases, the values increase, transitioning through purple, pink, orange, and yellow. The top-right region (high 'p' and high 'c') shows a mix of yellow and orange. The bottom right corner (high 'p', low 'c') is dark blue.
* Specifically, for p values between 0.0 and 0.2, the value increases significantly as 'c' increases from 0.0 to approximately 0.5, then remains relatively high (yellow/orange) for higher 'c' values. For higher 'p' values (0.6 to 1.0), the value remains low (dark blue) regardless of the 'c' value.
### Key Observations
* Heatmaps (a), (b), (d), and (e) show relatively uniform low values across most of the parameter space, with some exceptions along the c=0.0 line.
* Heatmaps (c) and (f) exhibit a more complex relationship between 'p', 'c', and the function's output, with higher values concentrated in the upper-left region (low 'p', high 'c').
* The transition from low to high values in heatmaps (c) and (f) appears to occur around p=0.2 to 0.4.
### Interpretation
The heatmaps likely represent the behavior of a system under different parameter settings. The parameters 'p' and 'c' have a significant impact on the system's output, as seen in heatmaps (c) and (f). The other heatmaps (a, b, d, e) may represent baseline conditions or scenarios where the system is inactive or suppressed.
The fact that heatmaps (c) and (f) show similar patterns suggests that the underlying system is sensitive to the interaction between 'p' and 'c'. Specifically, low values of 'p' combined with high values of 'c' result in a high output. This could represent a scenario where 'p' is an inhibitory factor and 'c' is an activating factor, or vice versa.
The thin lines of higher values along c=0.0 in heatmaps (b), (d), and (e) suggest that there might be a specific behavior or state of the system when 'c' is close to zero, regardless of the value of 'p'. This could indicate a boundary condition or a default state of the system.