## Heatmaps: Correlation Matrices
### Overview
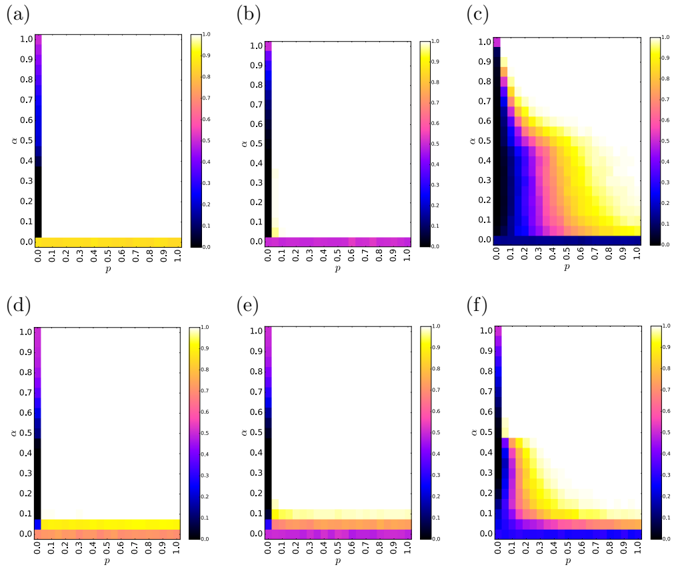
The image presents six heatmaps, labeled (a) through (f). Each heatmap appears to represent a correlation matrix, visualizing the relationship between two variables, 'p' and 'q', across a range of values from 0.0 to 1.0. The color intensity represents the correlation strength, with a colorbar indicating the mapping between color and correlation value.
### Components/Axes
Each heatmap shares the following components:
* **X-axis:** Labeled 'p', ranging from 0.0 to 1.0 with markers at 0.0, 0.1, 0.2, 0.3, 0.4, 0.5, 0.6, 0.7, 0.8, 0.9, and 1.0.
* **Y-axis:** Labeled 'q', ranging from 0.0 to 1.0 with markers at 0.0, 0.1, 0.2, 0.3, 0.4, 0.5, 0.6, 0.7, 0.8, 0.9, and 1.0.
* **Colorbar:** Located to the right of each heatmap, ranging from approximately 0.0 (dark purple) to 1.0 (yellow). The colorbar is labeled with numerical values representing correlation strength.
### Detailed Analysis or Content Details
Each heatmap displays a different correlation pattern. I will describe each individually:
**(a)**: The heatmap shows a strong positive correlation along the diagonal (where p = q). Values are approximately 1.0 along the diagonal. Correlation decreases as the difference between 'p' and 'q' increases. Values near 0.0 are observed in the bottom-left and top-right corners.
**(b)**: Similar to (a), a strong positive correlation is present along the diagonal (values around 1.0). However, the correlation drops off more rapidly as 'p' and 'q' diverge. Values near 0.0 are more prominent than in (a).
**(c)**: Again, a strong positive correlation along the diagonal (values around 1.0). The correlation decreases more gradually than in (b), but still shows a clear trend of decreasing correlation with increasing difference between 'p' and 'q'.
**(d)**: This heatmap exhibits a different pattern. While there's still a positive correlation along the diagonal (values around 1.0), the correlation remains relatively high even when 'p' and 'q' are different. The lower-left corner shows values around 0.2-0.3, indicating some positive correlation even at p=0.0 and q=0.0.
**(e)**: Similar to (d), a relatively high correlation is maintained across a wider range of 'p' and 'q' values. The diagonal shows values around 1.0, and the lower-left corner has values around 0.3-0.4.
**(f)**: This heatmap shows a pattern similar to (c) and (a), with a strong diagonal correlation (values around 1.0) and a decrease in correlation as 'p' and 'q' diverge. The lower-left corner shows values around 0.1-0.2.
### Key Observations
* All heatmaps exhibit a strong positive correlation when 'p' equals 'q' (diagonal).
* The rate at which correlation decreases as 'p' and 'q' diverge varies significantly between the heatmaps.
* Heatmaps (d) and (e) show a more sustained positive correlation even when 'p' and 'q' are different, suggesting a stronger underlying relationship between the variables.
* The color scales are consistent across all heatmaps, allowing for direct visual comparison of correlation strengths.
### Interpretation
These heatmaps likely represent the correlation between two parameters, 'p' and 'q', under different conditions or for different datasets. The variations in correlation patterns suggest that the relationship between 'p' and 'q' is not static and is influenced by external factors.
The strong diagonal correlation in all heatmaps indicates that when 'p' and 'q' are equal, they are highly related. The differences in the off-diagonal correlations suggest that the strength of this relationship depends on the specific context represented by each heatmap.
Heatmaps (d) and (e) suggest a more robust relationship between 'p' and 'q', as they maintain a relatively high correlation even when the values differ. This could indicate a fundamental connection between the variables that is not easily disrupted.
The variations between the heatmaps could be due to different experimental conditions, different datasets, or different stages of a process. Further investigation would be needed to determine the specific factors that contribute to these differences.