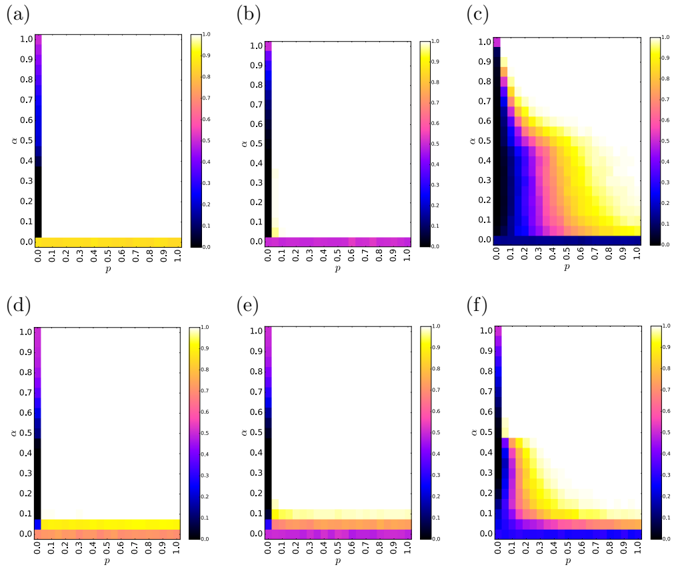
## Heatmap Visualization: Relationship Between p and α
### Overview
The image contains six heatmaps (a-f) arranged in two rows, each depicting the relationship between two variables: **p** (x-axis) and **α** (y-axis). Color gradients represent values ranging from 0 (dark blue) to 1 (yellow), with distinct patterns emerging in each subplot. All heatmaps share identical axis labels and color scales, but exhibit unique spatial distributions of intensity.
---
### Components/Axes
- **X-axis**: Labeled **p**, ranging from 0.0 to 1.0 in increments of 0.1.
- **Y-axis**: Labeled **α**, ranging from 0.0 to 1.0 in increments of 0.1.
- **Color Scale**: Right-aligned legend with values from 0 (dark blue) to 1 (yellow), labeled **α**.
- **Subplot Labels**: Top-left corner of each heatmap marked (a)-(f).
- **Gridlines**: Subtle gridlines separate cells in all heatmaps.
---
### Detailed Analysis
#### (a)
- **Pattern**: Vertical gradient from black (α=0) at the bottom to yellow (α=1) at the top, concentrated at **p=0.0**.
- **Key Values**:
- α=0.0: Entire row black (p=0.0–1.0).
- α=1.0: Entire column yellow (p=0.0–1.0).
#### (b)
- **Pattern**: Horizontal gradient from black (α=0) at the bottom to yellow (α=1) at the top, concentrated at **α=0.0**.
- **Key Values**:
- α=0.0: Entire row yellow (p=0.0–1.0).
- α=1.0: Entire column black (p=0.0–1.0).
#### (c)
- **Pattern**: Diagonal gradient from bottom-left (α=0, p=0.0) to top-right (α=1, p=1.0), with increasing intensity along the diagonal.
- **Key Values**:
- α=0.0: Black at p=0.0, transitions to yellow at p=1.0.
- α=1.0: Yellow at p=0.0, transitions to black at p=1.0.
#### (d)
- **Pattern**: Horizontal gradient at the bottom (α=0.0–0.1), with yellow dominating **α=0.0** and fading to black at **α=0.1**.
- **Key Values**:
- α=0.0: Entire row yellow (p=0.0–1.0).
- α=0.1: Entire row black (p=0.0–1.0).
#### (e)
- **Pattern**: Vertical gradient on the left (p=0.0–0.1), with yellow dominating **p=0.0** and fading to black at **p=0.1**.
- **Key Values**:
- p=0.0: Entire column yellow (α=0.0–1.0).
- p=0.1: Entire column black (α=0.0–1.0).
#### (f)
- **Pattern**: Diagonal gradient from top-left (α=1, p=0.0) to bottom-right (α=0, p=1.0), with intensity decreasing along the diagonal.
- **Key Values**:
- α=1.0: Yellow at p=0.0, transitions to black at p=1.0.
- α=0.0: Black at p=0.0, transitions to yellow at p=1.0.
---
### Key Observations
1. **Concentration of Intensity**:
- (a) and (b) show extreme concentration at single axes (p=0.0 or α=0.0).
- (c) and (f) exhibit diagonal correlations between p and α.
- (d) and (e) localize intensity to narrow bands (α=0.0 or p=0.0).
2. **Symmetry**:
- (a) and (d) share horizontal/vertical symmetry but differ in gradient direction.
- (b) and (e) mirror each other’s axis-specific intensity.
3. **Diagonal Trends**:
- (c) and (f) suggest inverse relationships: (c) increases with p/α, (f) decreases.
---
### Interpretation
The heatmaps likely represent probabilistic or statistical relationships between **p** (e.g., probability) and **α** (e.g., confidence threshold). The diagonal patterns in (c) and (f) imply a trade-off or direct correlation between the variables, while (a)-(b) and (d)-(e) suggest boundary conditions where one variable dominates. The consistent color scale across subplots allows direct comparison of intensity distributions, highlighting how parameter space is partitioned. Outliers like the sharp transitions in (d) and (e) may indicate threshold effects or discrete states in the modeled system.