\n
## Diagram: Cooperative Game Theory Illustration
### Overview
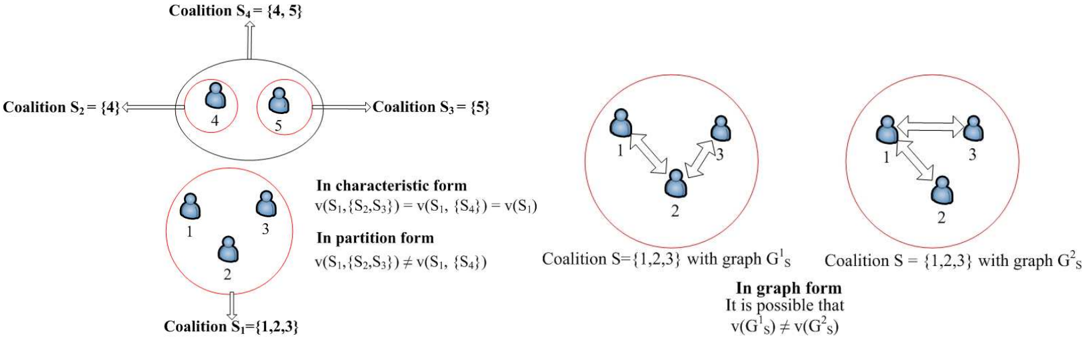
The image is a diagram illustrating concepts from cooperative game theory, specifically focusing on coalitions and their values in characteristic and partition forms, and their representation in graph form. It depicts several coalitions of players (numbered 1 through 5) and their relationships, along with textual explanations of the mathematical properties involved.
### Components/Axes
The diagram consists of several interconnected components:
* **Coalition Diagrams:** Four circular diagrams representing coalitions S1, S2, S3, and S4. Each diagram contains numbered nodes representing players.
* **Arrows:** Arrows connecting the coalition diagrams, indicating relationships or potential formations.
* **Text Blocks:** Several text blocks explaining concepts in characteristic and partition forms, and graph forms.
* **Coalition Labels:** Labels identifying each coalition (e.g., "Coalition S1 = {1,2,3}").
* **Graph Representations:** Two diagrams representing coalitions in graph form (G1s and G2s).
### Detailed Analysis or Content Details
**Coalition S1 = {1,2,3}:**
* Players: 1, 2, and 3.
* Position: Bottom-left of the diagram.
* Visual Representation: A circle enclosing three nodes labeled 1, 2, and 3.
**Coalition S2 = {4}:**
* Player: 4.
* Position: Bottom-center of the diagram.
* Visual Representation: A circle enclosing a single node labeled 4.
**Coalition S3 = {5}:**
* Player: 5.
* Position: Bottom-right of the diagram.
* Visual Representation: A circle enclosing a single node labeled 5.
**Coalition S4 = {4,5}:**
* Players: 4 and 5.
* Position: Top-center of the diagram.
* Visual Representation: A circle enclosing nodes labeled 4 and 5.
**Arrows:**
* An arrow points from Coalition S2 ({4}) to Coalition S4 ({4,5}).
* An arrow points from Coalition S3 ({5}) to Coalition S4 ({4,5}).
* An arrow points from Coalition S1 ({1,2,3}) downwards.
**Text Blocks:**
* **In characteristic form:** "v(S1, {S2,S3}) = v(S1, {S4}) = v(S1)"
* **In partition form:** "v(S1, {S2,S3}) ≠ v(S1, {S4})"
* **Coalition S = {1,2,3} with graph G1s:** This is accompanied by a graph representation with nodes 1, 2, and 3 connected by edges.
* **Coalition S = {1,2,3} with graph G2s:** This is accompanied by a graph representation with nodes 1, 2, and 3 connected by edges.
* **In graph form:** "It is possible that v(G s) ≠ v(G2s)"
**Graph Representations:**
* **G1s:** Nodes 1, 2, and 3 are connected in a triangular fashion.
* **G2s:** Nodes 1, 2, and 3 are connected in a triangular fashion.
### Key Observations
* The diagram highlights the difference between characteristic and partition forms of coalition values.
* The graph representations (G1s and G2s) suggest that different graph structures can lead to different coalition values.
* The inequality in the partition form indicates that the value of a coalition and its sub-coalitions can differ depending on how they are formed.
### Interpretation
The diagram illustrates a fundamental concept in cooperative game theory: the value of a coalition is not always simply the sum of the values of its sub-coalitions. The characteristic form assumes additivity, while the partition form acknowledges that the order and manner in which coalitions are formed can affect their overall value. The graph representations demonstrate how the structure of relationships between players (represented by the graph) can influence the value of a coalition. The inequality "v(G s) ≠ v(G2s)" suggests that even with the same players, different network structures can lead to different outcomes. This has implications for understanding strategic interactions and coalition formation in various contexts, such as economics, political science, and social networks. The diagram is a visual aid for understanding the mathematical properties of coalition values and the importance of considering the context in which coalitions are formed.